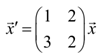
Sketch several trajectories for the system,
x1' = x1 + 2x2
x2' = 3x1 + 2x2
Solution
Therefore, what we require to do is pick several points in the phase plane, plug them in the right side of the system. We'll perform it for a couple of points.
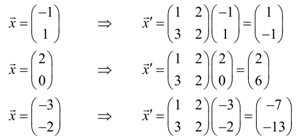
Therefore, what does it tell us? Fine at the point (-1, 1) under the phase plane there will be a vector pointing toward <1,-1>. At the point (2,0) here will be a vector pointing toward <2, 6>. At the point (-3,-2) here will be a vector pointing toward <-7, -13>. Doing this for a huge number of points under the phase plane will provide the subsequent sketch of vectors.
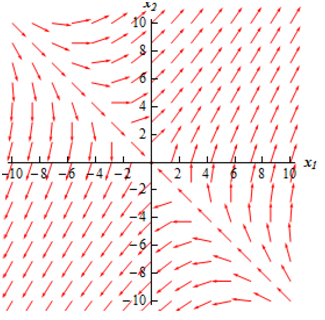
Here all we require to do is sketch in some trajectories. To perform this all we require to do is keep in mind that the vectors in the sketch above are tangent to the trajectories. As well as the directions of the vectors provide the direction of the trajectory as t raises thus we can demonstrate the time dependence of the solution with adding in arrows to the trajectories.
Doing this provides the following sketch.
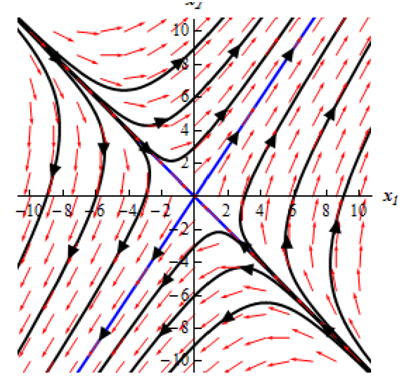
This sketch is termed as the phase portrait. Generally phase portraits only comprise the trajectories of the solutions and not any vectors. Each of our phase portraits by this point on will only contain the trajectories.
Under this case this looks like most of the solutions will begin away from the equilibrium solution after that as t begins to increase they move in the directions of the equilibrium solution and then finally start moving away from the equilibrium solution again.
There appear to be four solutions which have slightly different behaviors. This looks like two of the solutions will begin at or near at least the equilibrium solution and them move straight away from.
It whiles two other solution starts away from the equilibrium solution and after that move straight in directions of the equilibrium solution.
In these types of cases we describe as the equilibrium point a saddle point and we term as the equilibrium point under this case unstable as all but two of the solutions are moving away from this as t increases.
Since we noted previous this is not usually the way which we will sketch trajectories. All we really require to find the trajectories are the eigen-values and eigen-vectors of the matrix A. We will notice how to do this over the subsequent couple of sections as we resolve the systems.
Now there are some more phase portraits so you can notice some more possible illustrations. We'll in fact be generating several of these during the course of the subsequent couple of sections.
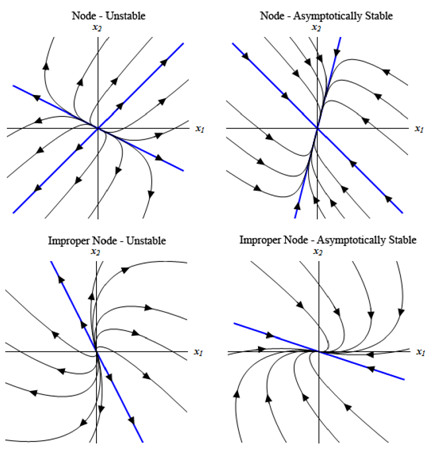
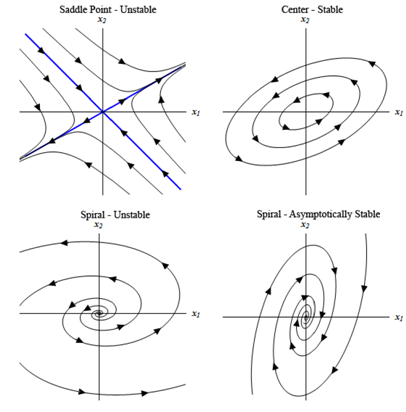
Not all probable phase portraits have been demonstrated here. These are now to demonstrate you a few of the possibilities. Ensure to notice that several types can be either asymptotically unstable or stable depending upon the direction of the arrows.
Remember the difference in among stable and asymptotically stable. For an asymptotically stable node or spiral all the trajectories will shifts in the directions of the equilibrium point as t increases, while a center that is always stable trajectory will just move around the equilibrium point although never really move in towards this.