Show the ad curve over time, Macroeconomics

Assignment Help:

Q. Show the AD curve over time?

With inflation, AD curve will no longer be stable over time. In its place, it will glide upwards or downwards at a rate determined by growth rate of the money supply ΠM. Let's look at the case ΠM = 10%.

If AD1 is AD curve in year 1, AD1would show us all combinations of Y and P where both markets are in equilibrium in year 1. For instance, both markets are equilibrium at point A where P = 100 and Y = 10. 

Figure: AD curve glides if ΠM 0

588_Show the AD curve over time.png

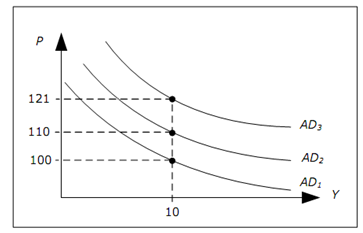
In year 2, money supply is higher - it has increased by just 10%. If P had increased by 10%, then this new value of P together with the level of GDP we had last year would still give us equilibrium in both markets. Inflation has then been 10% and none of the LM or IS curves have shifted.  

In year 2, P = 110 and Y = 10 should be on AD2. In year 3, by same arguments, P = 110.1.1 = 121 and Y = 10 should be on the AD3 and we see that AD curve glides upwards by 10% per year - exactly the same rate as growth in the money supply.


We should remember that if ΠM ≠ 0, then AD curve is applicable only for a given point in time. At another point in time, we should draw a different AD-curve. The rate at which AD curve glides is equal to ΠM - if ΠM is high, a higher inflation is essential if the same level of GDP is to lead to equilibrium in both markets. 

Even though ΠM determines evolution of the AD curve over time, there are still many combinations of Y and P leading to equilibrium in the goods- and money market (all points on the AD curve at specifically the given point in time). Only one point will be an equilibrium point for the entire economy and as before, AS curve will help us to find this point.


Related Discussions:- Show the ad curve over time

Wages, what is a wage? and the difference between real and nominal wages gi...

what is a wage? and the difference between real and nominal wages giving examples?

What are the profit-maximizing levels, Suppose Zippy's Banana Juice can pro...

Suppose Zippy's Banana Juice can produce according the following long-run production function. Q = 5 L 2 + 20 K - 0.4 K 2 where Q is gallons of juice per hour, L is labor hours,

Lag length critera, can u please tell me why lag length criteria is used du...

can u please tell me why lag length criteria is used during estimation of VAR model? what is the purpose of lag length criteria and how it can be interpreted?

Determine the output level-wholesale price, Assume an industry with one ups...

Assume an industry with one upstream and one downstream monopoly. The upstream monopoly produces Q , which is sold solely to the downstream monopoly. The downstream monopoly faces

Money and banking, Suppose the price level in year 2009 is 100 and $100 buy...

Suppose the price level in year 2009 is 100 and $100 buys 100 notebooks that year. If the price level rises to 125 in year 2010, what is the new value or purchasing power of the do

Define gdp, A farmer grows a bushel of wheat & sells it to a miller for Rs....

A farmer grows a bushel of wheat & sells it to a miller for Rs. 1.00. The miller turns the wheat into flour & then sells the flour to a baker for RS. 3.00. The baker uses the f

Fiscal, what is the supply side

what is the supply side

IS LM curve, example on the calculation of IS LM Curve?

example on the calculation of IS LM Curve?

Assignment, Can i have a guide on a particular macroeconomics assignment? I...

Can i have a guide on a particular macroeconomics assignment? I have totally no idea on how to start it. Please reply and i will show the question.

Write Your Message!

Captcha
Free Assignment Quote

Assured A++ Grade

Get guaranteed satisfaction & time on delivery in every assignment order you paid with us! We ensure premium quality solution document along with free turntin report!

All rights reserved! Copyrights ©2019-2020 ExpertsMind IT Educational Pvt Ltd