Show calculation of project net present value, Financial Accounting

Assignment Help:

Q. Show Calculation of project net present value?

606_Show Calculation of project net present value.png

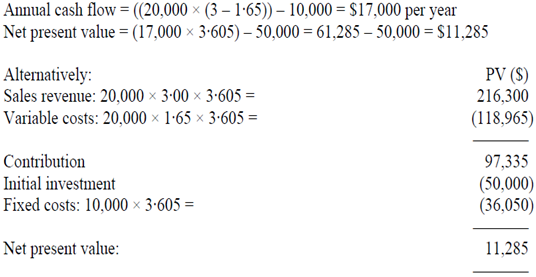
Sensitivity of NPV to sales volume

Sales volume giving zero NPV = ((50000/3·605) + 10000)/1·35 = 17681 units

This is a reduce of 2319 units or 11·6%

On the other hand sales volume decrease = 100 × 11285/97335= 11·6%

Sensitivity of NPV to sales price

Sales price for zero NPV = (((50000/3·605) + 10000)/20000) + 1·65 = $2·843

This is a decrease of 15·7c or 5·2%                                                            

On the other hand sales price decrease = 100 × 11285/216300 = 5·2%

Sensitivity of NPV to variable cost

Variable cost should increase by 15·7c or 9·5% to $1·81 to make the NPV zero.

On the other hand variable cost increase = 100 × 11285/118965 = 9·5%

Sensitivity analysis assesses the effect on project net present value of changes in project variables. The purpose is to determine the key or critical project variables which are those where the smallest change produces the biggest change in project NPV. It is restricted in that only one project variable at a time may be changed whereas in reality several project variables may change simultaneously. For instance an increase in inflation could result in increases in variable costs, sales price and fixed costs.

Sensitivity analysis isn't a way of evaluating project risk since though it may identify the key or critical variables it can't assess the likelihood of a change in these variables. Alternatively sensitivity analysis doesn't assign probabilities to project variables. Where sensitivity analysis is helpful is in drawing the attention of management to project variables that require careful monitoring if a particular investment project is to meet expectations. Sensitivity analysis is able to as well highlight the need to check the assumptions underlying the key or critical variables.


Related Discussions:- Show calculation of project net present value

Determine the net cash provided by operating activities, Van Aalst Company'...

Van Aalst Company's comparative balance sheet and income statement for last year appear below: Comparative Balance Sheet

Significance in working capital cycle, For several firms trade payables - s...

For several firms trade payables - suppliers of goods and services - represent the major component of current liabilities the amounts owed by the company which have to be repaid wi

Interest is deductible on schedule a, Heather & Terry have a mortgage on th...

Heather & Terry have a mortgage on their primary residence of $750,000 and a mortgage on their vacation home of $410,000. In 2013, they incurred $46,400 of mortgage interest expens

Rate of return on the market, The risk-free rate of return, rRF , is 10%; t...

The risk-free rate of return, rRF , is 10%; the needed rate of return on the market, rM, 16%; and Schuler Company's stock has a beta coefficient of 1.6. a.       If the dividend

With the ddm formula calculated growth rate, Using CAPM's formula, Retur...

Using CAPM's formula, Return on equity = Risk-free rate + Beta*(Expected market return - risk-free rate) With the given information, Return on equity = 1% + 1.7*(9% - 1%)

How much of the existing cash balance, As of January 1, 2011, the partnersh...

As of January 1, 2011, the partnership of Canton, Yulls, and Garr had the following account balances and percentages for the sharing of profits and losses: Cash 80,000 non cash

Describe passive income, Q. Describe Passive Income? Passive Income - I...

Q. Describe Passive Income? Passive Income - Includes income derived from such sources like dividends, royalties, interest, rents, amounts received from personal service contra

Comparative income satement in good form, Ask questihow to make comparative...

Ask questihow to make comparative income statement in good formon #Minimum 100 words accepted#

Fin 501, Look closely at the stock market in Fiji. Do a trend analysis of t...

Look closely at the stock market in Fiji. Do a trend analysis of the stock market based on the following: ? The function of the stock market ? The trend analysis of the number of

Management and operational control, Management and operational control: Co...

Management and operational control: Cost of goods sold and gross margin analysis, profit as net income analysis, operating expense analysis, contribution analysis and analysis of

Write Your Message!

Captcha
Free Assignment Quote

Assured A++ Grade

Get guaranteed satisfaction & time on delivery in every assignment order you paid with us! We ensure premium quality solution document along with free turntin report!

All rights reserved! Copyrights ©2019-2020 ExpertsMind IT Educational Pvt Ltd