Relation between average cost and marginal cost, Managerial Economics

Assignment Help:

Q. Relation between average cost and marginal cost?

Relationship between MC and AC are the following:

  • If MC is below AC then AC should be falling. This is because, if MC is below AC then last unit produced costs less than AC of all the earlier units produced. If last unit costs less than earlier ones, then new AC should be less than old AC. So AC should be falling.
  • If MC is above AC then cost of the last unit produced will be higher than AC of the earlier units. Henceforth the new AC should be higher than old AC. So when MC is above AC, AC should be rising.
  • If MC is equal to AC, last unit costs exactly the same as AC of all earlier units. Therefore the new AC is equal to old AC. So the AC curve is flat when AC equals MC. Above mentioned relationship between MC and AC can be seen clearly with the help of figure below.
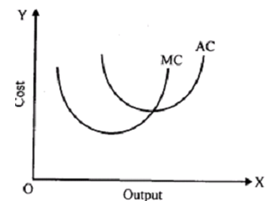
1199_Relation between average cost and marginal cost.png

Figure: Relation between AC and MC

To the left of lowest point of the AC curve, MC is below AC so AC curve is falling. Even if MC is rising, AC would continue to fall as long as rising MC is less than AC. To the right of minimum point of the AC curve, MC is above AC so AC curve is rising. At the point where MC equals AC, AC curve is flat. Therefore the rising MC curve cuts AC curve at its lowest point.

Relationship between MC and AC can be easily understood by an illustration of a cricket player's batting averages. Let's presume that a cricket player's batting average is 40.

If in his next innings, he scores less than 40, let's suppose 30, then his average score would fall since his marginal score is less than his average score. In its place, if he scores more than 40, say 50, in his following innings, then his average score would increase since his marginal score is greater than his previous average score. Conversely, supposing the average score is 40, if batsman scores 40 in his subsequent innings then his average score would remain the same and his average and marginal scores will be equal.


Related Discussions:- Relation between average cost and marginal cost

Income elasticity of demand, Aside from the price of a product and its subs...

Aside from the price of a product and its substitutes, another significant element of demand for a product is consumer's income. As noticed previously, relationship between demand

Show the method of production, Q. Show the method of production? A proc...

Q. Show the method of production? A process or method of production is a combination of inputs essential for the production of output. A method of production is technically eff

Economic effects of taxation, ECONOMIC EFFECTS OF TAXATION a.  A det...

ECONOMIC EFFECTS OF TAXATION a.  A deterrent to work Heavy direct taxation, especially when closely linked to current earnings, can act as a serious check to production

Define the analysis of mathematical functions, Time domain: Time domain is...

Time domain: Time domain is a term which is used to define the analysis of mathematical functions or physical signals, with respect to time. In the time domain, signal or function

Elasticity, The acme paper company lowers its price of envelopes (1000 cou...

The acme paper company lowers its price of envelopes (1000 count) from $6to $5.40.

Money markets, MONEY MARKETS The expression "money markets" is used ...

MONEY MARKETS The expression "money markets" is used to refer to the set of institutions and individuals who are engaged in the borrowing and lending of large sums of money

Determine the perfectly competitive firms profit, 1. Suppose in a perfectly...

1. Suppose in a perfectly competitive industry the market demand and supply forces combine to produce a short-run equilibrium price of Rs 70. Suppose that a firm in this industry h

Point elasticity of demand, calculate point elasticity of demand for demand...

calculate point elasticity of demand for demand function q=10-2p for decrease in price from rs 3 to rs 2

The individual and market demand curves, The individual and market demand c...

The individual and market demand curves The quantities and prices in the demand schedule can be plotted on a graph. Such a graph after the individual demand schedule is called

Write Your Message!

Captcha
Free Assignment Quote

Assured A++ Grade

Get guaranteed satisfaction & time on delivery in every assignment order you paid with us! We ensure premium quality solution document along with free turntin report!

All rights reserved! Copyrights ©2019-2020 ExpertsMind IT Educational Pvt Ltd