Recent development in demand analysis, Microeconomics

Assignment Help:

RECENT DEVELOPMENT IN DEMAND ANALYSIS:

For many years economic theorists analysed the optimal behaviour of consumers while econometricians estimated consumer demand and expenditure relations, with little communication between the two. Theorists would provide examples that were of little aid for empirical work, and econometricians would estimates relations that had little connection with the theory of utility maximisation. Fortunately, as days passed on, the gap between theory and empirical evidence has lessened, and a number of theoretically strong examples that allow empirical estimation have been developed. In this section we present one of such examples.  
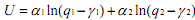
127_RECENT DEVELOPMENT IN DEMAND ANALYSIS.png

with the domain q11 and q22. The  γ's may be interpreted as minimum subsistence quantities and are positive. The α's are also positive. Applying the positive monotonic transformation U' = U/(α +α ) we get,  
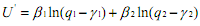
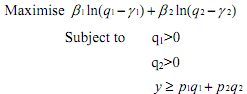
2426_RECENT DEVELOPMENT IN DEMAND ANALYSIS1.png

The coefficients β1 and β21+ β2 = 1) are called "share" parameters. The consumer's objective is to maximise her utility subject to budget constraint. So, she will try to solve the problem given below. 

2482_RECENT DEVELOPMENT IN DEMAND ANALYSIS2.png

We set Lagrange function of the above maximisation exercise as  

1950_RECENT DEVELOPMENT IN DEMAND ANALYSIS3.png

and set its first partial derivatives equal to zero (we assume interior solution of this maximisation problem):  

954_RECENT DEVELOPMENT IN DEMAND ANALYSIS4.png

1724_RECENT DEVELOPMENT IN DEMAND ANALYSIS5.png

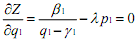
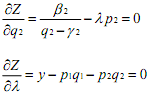
It can be easily verified that the second order condition for the maximisation is satisfied. By evaluating the above three equation one can also find out that the marginal utility of income is decreasing. 

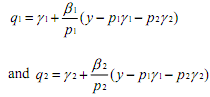
Solving the above equations for optimal quantities gives the demand functions,  

563_RECENT DEVELOPMENT IN DEMAND ANALYSIS6.png

Multiplying the first equation of the above two demand functions by p1 and the second by p2 we get the expenditure functions  

1646_RECENT DEVELOPMENT IN DEMAND ANALYSIS7.png

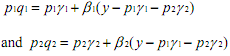
which are linear in income and prices, and thus suitable for linear regression analysis.  


Related Discussions:- Recent development in demand analysis

Brief overview on signs and symptoms, Project requirements: Refer to Table...

Project requirements: Refer to Table and answer the following questions for EACH organism listed above. Word requirements are outlined for each question - this represents a minim

I am concerned that if we get into price war with Ev, I am concerned that i...

I am concerned that if we get into price war with Everest Solution

Market output of company, (a) Increase in technology and productivity take ...

(a) Increase in technology and productivity take effect in the red bull market use and label a graph to explain the result of this change on each of the following (i) Market Pri

What factors shift the aggregate demand curve to right, What factors shift ...

What factors shift the Aggregate demand curve to right and what factors shift the AD curve to left?  AD shifts to the right when any component of AD enhances autonomously; e.g

What is black marketing, What is black marketing?  Black Marketing mean...

What is black marketing?  Black Marketing means hoarding of sure commodity to sell it at higher prices. But it is an illegal activity in the economy and makes artificial shorta

Mediterranean regional project (mrp) technique, Mediterranean Regional Proj...

Mediterranean Regional Project (MRP) Technique This technique had been initially employed by the OECD (Organisation of Economic Cooperation and Development, Europe) to prepare

Determine the slutsky equation, Determine the Slutsky Equation. Income-...

Determine the Slutsky Equation. Income-Substitution Effect: The Slutsky Equation A fall into the price of a good may have two sorts of consequences: substitution effect, whe

Economics principle.., During the 1990s, technological advance reduced the ...

During the 1990s, technological advance reduced the cost of computer chips. Explain, with the use supply and demand diagrams, how the following markets are affected in terms of pr

Write Your Message!

Captcha
Free Assignment Quote

Assured A++ Grade

Get guaranteed satisfaction & time on delivery in every assignment order you paid with us! We ensure premium quality solution document along with free turntin report!

All rights reserved! Copyrights ©2019-2020 ExpertsMind IT Educational Pvt Ltd