Principles behind ecg monitoring, Electrical Engineering

Assignment Help:

a) Provide pertinent summary of the basic principles behind ECG monitoring

b) Using MATLAB, provide plots of the "clean" and "noisy" ECG signals. Investigate the spectral estimation of the clean and noisy signals, using MATLAB code and SPTOOL, Discuss fully the results and conclusions that you reach.

c) Using your findings in Q1, design  FIR filters.

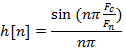
i) The following equation, is an approximation of an impulse response for a FIR filter. Using MATLAB coding design a FIR filter, with the Hamming window applied to its coefficients. Once you are satisfied with your design, using convolution apply your filter to the noisy ECG signal.

767_Principles behind ECG monitoring.png

ii) Using your findings in Q1(a) and Q1(b),  design appropriate FIR filters in SPTOOL.  Apply each appropriate filter design to the noisy signal, to allow comparison of the result in Q1(c)(i).

iii) Compare and contrast your results.

d) Using SPTOOL, design an IIR digital filter and compare the performance  to the FIR filters designed in Q1


Related Discussions:- Principles behind ecg monitoring

Obtain the z-parameters for the circuit, Q. (a) Consider the capacitor -...

Q. (a) Consider the capacitor - input filter circuit of Figure and obtain the z-parameters for the circuit. (b) Determine the transfer function V 2 /V 1 when I 2 is zero.

Obtain expressions for the open-loop voltage gain, Q. Consider the op-amp c...

Q. Consider the op-amp circuit shown in Figure and obtain expressions for the open-loop voltage gain at (a) low and (b) high frequencies. Also determine relations for the 3-dB poin

Working of hartley oscillator, Working of Hartley oscillator : When the...

Working of Hartley oscillator : When the collector supply voltage Vcc is switched on, the capictor gets charged. The capacitor discharges through the inductor, setting up oscil

Op amps, calculating different op amps

calculating different op amps

Engineering drawing, connect two given points A and B by a parabolic curve ...

connect two given points A and B by a parabolic curve when OA=60mm,OB=80mm and angle AOB=110 degree

Energy band diagram, E n e r gy Band Diagram Energy band d...

E n e r gy Band Diagram Energy band diagram in qualitative form is sketched by following the following process: 1. The semiconductor device is supposed to be ma

Explain the terms dielectric constant and dielectric loss, Explain the term...

Explain the terms dielectric constant and dielectric loss. Dielectric Constant or Permittivity: all insulating materials possess an electrical capacitance. The capacitance of

Metering technologies, Metering Technologies An electric meter or ener...

Metering Technologies An electric meter or energy meter is a device in which measures the amount of electrical energy supplied to customers of an electric supply company. Elec

Mode 1 - boost converter, Mode 1 In this mode  transistor Q gets turne...

Mode 1 In this mode  transistor Q gets turned on by the positive output  of the PWM. After  that current  flows  through  inductor L  transistor Q then back  to supply  in thi

Write Your Message!

Captcha
Free Assignment Quote

Assured A++ Grade

Get guaranteed satisfaction & time on delivery in every assignment order you paid with us! We ensure premium quality solution document along with free turntin report!

All rights reserved! Copyrights ©2019-2020 ExpertsMind IT Educational Pvt Ltd