Portfolio selection problem, MATLAB Programming

Assignment Help:

An individual with $10,000 to invest has identi?ed three mutual funds as attractive opportunities. Over the last ?ve years, dividend payments (in cents per dollar invested) have been as shown in Table 5, and the individual assumes that these payments are indicative of what can be expected in the future. This particular individual has two requirements:

(1) the combined expected yearly return from his/her investments must be no less than $800 (the amount $10,000 would earn at 8 percent interest) and (2) the variance in future, yearly, dividend payments should be as small as possible. How much should this individual invest in each fund to achieve these requirements?

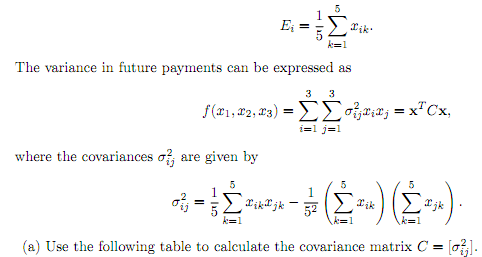
[Hint: Let xi(i =1, 2, 3) designate the amount of funds to be allocated to investment i, and let xik denote the return per dollar invested from investment i during the kth time period in the past (k =1, 2,..., 5). If the past history of payments is indicative of future performance, the expected return per dollar from investment i is

2116_Portfolio Selection Problem..png

(b) Set up a quadratic optimization problem that will determine the best investment mix.

(c) Solve the problem using the MATLAB quadratic optimization routine quadprog. Interpret your results.


Related Discussions:- Portfolio selection problem

Determine standard deviation, Find f(t) for each F(s): Problem: ...

Find f(t) for each F(s): Problem: Based on an examination given to a large class in which the maximum score is 100 points, assuming that 20 grades taken at random f

Sequence alignment and blast search, Calculating and Visualizing Sequence S...

Calculating and Visualizing Sequence Statistics Follow the instructions in this demo file to download a sequence and calculate and visualize its statistics. Save all the command

Programs to determine discrete fourier transform, A 12-point sequence is x ...

A 12-point sequence is x (n) defined as x(n) = { 1, 2, 3, 4, 5, 6, 6, 5, 4, 3, 2, 1}. Write MATLAB programs to (a) Determine the DFT X (k) of x(n) and plot (using stem function)

Illustration of function functions, Illustration of Function functions: ...

Illustration of Function functions: For illustration, to pass the sin function into fplot, one would pass its handle as shown in figure for the result.   >> fplot(@s

Video compression, please tell me how to compress a video in matlab

please tell me how to compress a video in matlab

Plot the input and the output of the filter on a single plot, An FIR filter...

An FIR filter has coefficients b = [ 1.0000   -0.6387    1.0214    0.8210   -0.7470    1.0920 ] (a) Find H(z) for the filter and plot its frequency response (magnitude and phase

Base o absorptoin system, plase help me to convert a theory part of ammonia...

plase help me to convert a theory part of ammonia-vapour simple absorption system into matlab programmong

Hand Detection, I need a source code for hand detection in matlab please .....

I need a source code for hand detection in matlab please ....

Write Your Message!

Captcha
Free Assignment Quote

Assured A++ Grade

Get guaranteed satisfaction & time on delivery in every assignment order you paid with us! We ensure premium quality solution document along with free turntin report!

All rights reserved! Copyrights ©2019-2020 ExpertsMind IT Educational Pvt Ltd