Examining the Population Variance
Business decision making does not limit itself to setting up the hypothesis to test for the equality of more than two means or proportions simultaneously. This may be attributed to the everchanging and dynamic economic environment. It throws up situations wherein, the managers not only have to deal with the means and proportions but also have to objectively look at and probe the extent as well as the magnitude of the variability present in the population, determine the accuracy of the estimate and the degree of uncertainty that can be associated with such estimates.
In this part of the chapter, first we will look at the distribution of the sample variance for a population and conclude this chapter after looking at the distribution for the sample variance of two populations.
Inference about a Population Variance
Since it is difficult to collect information about the population in an exhaustive manner, we employ the sample variance (s2) as an estimate for the population variance (s2). The square root of s2 and s2 gives us the standard deviation of the sample and the population. But to calculate the limits, we require a sampling distribution. If the population variance s2, exhibits the characteristics of a normal distribution then the corresponding statistic is better described by a Chi Square distribution with n - 1 degrees of freedom. The Chi Square statistic for a sample variance is given by
 |
......(1) |
It is then possible to use Chi Square distribution to arrive at the confidence intervals for the parameter s2. Since the confidence intervals and the testing of the hypothesis is about s2 the population variance, equation (1) can be rewritten as
This facilitates us to find the confidence intervals for s2. The lower and the upper confidence intervals are given by
Figure
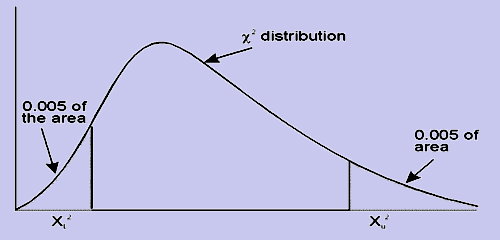
Since we know the values of  , the square root of these two will give us the confidence interval for the standard deviation.