Your first task is to realize two additional data generation functions. Firstly, extend the system to generate random integral numbers based on normal distribution. You need to study Data Generator's structure and extend number generation type to activate normal distribution. The interface needs to obtain both mean and sigma as shown in Figure 1. Consider the code found here which is reproduced below for your convenience:
function gauss() {
// N(0,1)
// returns random number with normal distribution:
// mean=0
// std dev=1
// auxiliary vars
$x=random_0_1();
$y=random_0_1();
// two independent variables with normal distribution N(0,1)
$u=sqrt(-2*log($x))*cos(2*pi()*$y);
$v=sqrt(-2*log($x))*sin(2*pi()*$y);
// i will return only one, couse only one needed
return $u;
}
function gauss_ms($m=0.0,$s=1.0) {
// N(m,s)
// returns random number with normal distribution:
// mean=m
// std dev=s
return gauss()*$s+$m;
}
function random_0_1() {
// auxiliary function
// returns random number with flat distribution from 0 to 1
return (float)rand()/(float)getrandmax();
}
Notice that the return value of the above code is a floating value. You can round it to nearest integer by adding a "rounding option" to the interface.
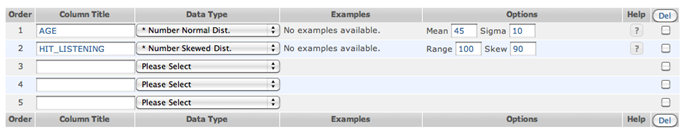
Figure: Functions added to Data Generator
Next, realize one form of skewed distribution that approximates Pareto Principle. Consider a skewed access pattern often evidenced in data applications such that s percent of accesses would go to (100 - s) percent of data items. For instance, a typical "80-20 rule" for 1000 accesses over 500 data items means that about 800 accesses (80% of accesses) go to a specific set of about 100 items (20% of data items). In our case, data generation should be based on independent repeated trials, not as all trials once in a batch. Therefore, implementing strict Pareto Principle is difficult. Instead, we can approximate access pattern generation by the following method:
• skew generation function receives a range r and a skew factor s as parameter, both of which are integers and r must be larger 1 while s must be between 50 and 100.
• data elements are considered to have unique IDs in the range [1, r], in which elements are listed in an increasing order of IDs such as 1, 2, 3, ..., r.
• skew generation function produces an integer value between 1 and r representing a data access in the following manner:
1. skewed access will go to the top portion of the elements, that is, those between 1 and t = r × (100 - s) / 100.
2. draw a random number p from uniform distribution between 0 and 99.
3. if p falls in less than s, i.e., [0, s - 1], the top portion of elements [1, t] is accessed.
4. otherwise the access goes to [t + 1, r].
Above illustration should be sufficient to provide you with the concrete requirement for the two frequently utilized data generation. Figure 1 and 2 shows interface and sample output respectively. In these figures, rounding to integer is applied automatically. A checkbox should be added to the interface so that users can choose whether values generated are rounded or not. Notice that this development is not from scratch, but is "reverse engineering" of already developed product. Addition of the above functions to Data Generator is easily done. You should look into the contents of docs/data_types.php.
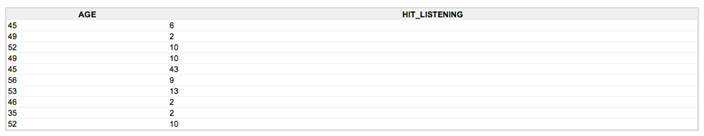
Figure: Generated data example