NON-ACCELERATING INFLATION RATE OF UNEMPLOYMENT
During 1970s economists encountered a puzzle in the sense that inflation and unemployment data did not fit into the Phillips curve for many developed economies. In fact many countries witnessed 'stagflation' - a combination of stagnation (a situation of high unemployment) and high inflation. The instability in the Phillips curve prompted economists to look into the possible reason of high inflation in spite of high unemployment in the economy.
A limitation of the Phillips curve is that both workers and employers take decisions on the basis of real wage, not nominal wage. As we mentioned earlier when we enter into a contract on a hture date we incorporate expected inflation into it. Milton Friedman and Edmund Pheips suggested that since real wage is what matters, the change in nominal wage has to be corrected by inflationary expectations. In the short-run the Phillips curve is stable but in the long run it shifts from one level to another, which makes the long run. Phillips curve a vertical-straight line. We explain the process through which shifts in Phillips curve takes place in Fig.
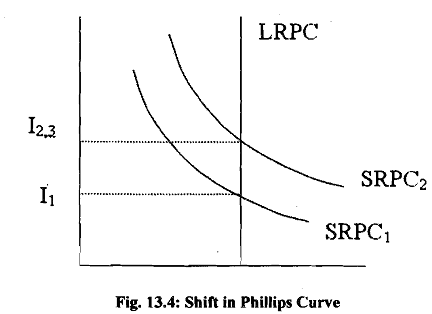
In order to explain the long run Phillips curve (LRPC) we take an example from Samuelson (2005). Let us assume an economy which is operating at the natural rate of unemployment (u*). The economy is operating at point A with low inflation rate I1 as in Fig. 13.4. People expect inflation rate to continue at I, in the next period also.
In the second period suppose the government follows an expansionary policy so that unemployment declines and is lower than u*. In this environment firms compete with each other to hire workers as a result of which wage rate increases. With little scope for further expansion in output the expansionary policy results in an increase in wage rate and prices so that the economy moves to point B on SRPCl in Fig. We note that inflation expectation has not changes so far and the economy is operating on SRPCI.
In the period 3 workers and employers perceive that there is an unexpected increase in inflation rate. Such a surprise prompts them to revise their inflationary expectations and they incorporate inflation at the rate I2 into their decisions. This results in an upward shift in the short run Phillips curve from SRPCn to SRPC2. Note that we have drawn SRPCz with inflation rate 13 which is equal to 12. With inflation at the rate 4, there is a decline in demand for labour the unemployment rate starts increasing and the economy moves to point C in Fig. The outcome of the above process is that the economy ends up with higher inflation rate although the rate of unemployment remains the same. Real GDP of the economy remains unchanged while nominal GDP is higher. The natural unemployment rate mentioned above is called non-accelerating inflation rate of unemployment (NAIRU). When unemployment is equal to NAIRU there will be stability in the rate of inflation. When unemployment departs from NAIRU, there is acceleration or deceleration in inflation rate. Thus if actual unemployment is less than u*, inflation will continue to accelerate- higher and higher in subsequent years. The concept of NAIRU and expectations formation explains the hyperinflation witnessed by some Latin American countries. Unless unemployment returns to its natural rate inflation spiral will keep on accelerating. The recessionary trend can also be explained by NAIRU. When unemployment is more than u*, inflation will tend to fall as long as unemployment is above u*.