Marginal damage curve , Managerial Economics

Assignment Help:

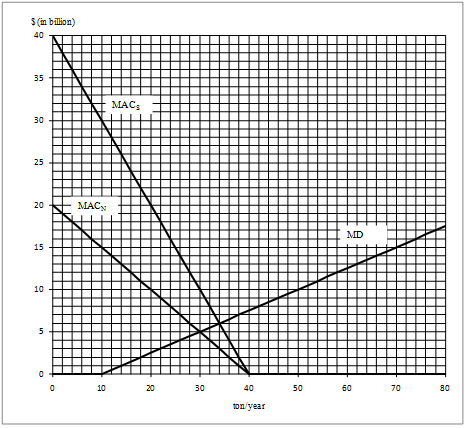
Consider a model world which is subject to a risk of global climate change. The damage is known to be from greenhouse gas (GHG) emissions as indicated by the marginal damage curve (MD) in the figure below. The model world consists of two regions, the North and the South, which have difference in technologies for reducing GHG emissions and thus marginal abatement cost curves (MACN and MACS). Note that GHG emission in the North and in the South together threat global climate. Pushed by increasing awareness of environmental issues among public, the authorities in two regions agree to empower the UN to introduce and enforce whatever measures to reduce GHG emissions within technological constraints (i.e. MACN and MACs).

47_Marginal damage curve.png

The UN is to reduce the GHG emissions to efficient level through command-and-control approach.

(a) What will be the standards in the North and the South?

North:

South:

(b) What will be the total abatement costs in the North and the South under these standards?

North:

South:

The UN is, instead, to reduce the GHG emissions to efficient level through a simple (one-part) emission charge.

(c) What will be the appropriate level of charge?

(d) How much will be the total emission charges (paid taxes) in the North and the South respectively in the equilibrium?

North:

South:

(e) The burden of emission charges is a concern of the authorities in the North and the South. How can the UN address to this problem while keeping incentive-based strategies? Give two ways to reduce/get rid of the burdens ("introducing transferrable discharge permits", which is studied below, will not be credited here).

The UN is, instead, to reduce the GHG emissions to efficient level through transferable discharge permits (each permit allows emission of 1 ton/year).

(f) How many permits should the UN issue? How much will a permit cost in equilibrium?

(g) Design the initial allocation of permits so that the South can benefit from reduced GHG emissions completely free of charge.

North:

South:

(h) What will happen to the price of permit when, while keeping the number of transferable permits issued by the UN, the North transfers its environmental technologies to the South so that the South is as cost-efficient as the North in reducing GHG emissions?

(i) How much will the North and the South emit GHG in equilibrium then?

North:

South:

(j) Is this an efficient equilibrium? If not, what should the UN do to achieve efficiency, while continuing to follow transferable discharge permits?


Related Discussions:- Marginal damage curve

Trade cycle-keynes and mitchell description, Keynes and  Mitchell Descript...

Keynes and  Mitchell Description According to Keynes description, a trade cycle is characterised by alternating expansionary and contractionary wavy movements in the aggregate

What do mean by convex isoquant, Q. What do mean by Convex Isoquant? I...

Q. What do mean by Convex Isoquant? Isoquants are convex to the origin: At any point of an isoquant,the slope is negative. Its numerical value measures the marginal rate of te

Will you make any profits in the short run, Problem 1: Using relevant e...

Problem 1: Using relevant examples, discuss the pricing strategies that firms can use to capture value from their customers. Problem 2: You are a manager in a perfectl

Show the uses of income elasticity, Q. Show the uses of income elasticity? ...

Q. Show the uses of income elasticity? A few significant uses of income elasticity are as follows: First, concept of income elasticity can be used to approximately compute t

Capital recovery factor, The owner of a patent has a contract with a cooper...

The owner of a patent has a contract with a cooperation that gives it right to use the patent. The cooperation will pay the patent owner $2500 yearly for the next 5 years, $3000 fo

Individual firm and market supply curves, Individual firm and market supply...

Individual firm and market supply curves The quantities and prices in the supply schedule can be plotted on a graph. Such a graph is called the firm supply curve. A fir

Describe about theory of firm, Q. Describe about Theory of Firm? Theory...

Q. Describe about Theory of Firm? Theory of the firm is associated to comprehending how firms come into being, what are their objectives, how they act and enhance their perform

Simple macro model, Using the same simple macro model we developed in Modul...

Using the same simple macro model we developed in Module 2: a.  Show what will happen to national income (GDP) if the administration implements another $100 (billion) stimulus s

Write Your Message!

Captcha
Free Assignment Quote

Assured A++ Grade

Get guaranteed satisfaction & time on delivery in every assignment order you paid with us! We ensure premium quality solution document along with free turntin report!

All rights reserved! Copyrights ©2019-2020 ExpertsMind IT Educational Pvt Ltd