Link functions:
The link function relates the linear predictor ηi to the expected value of the data. In classical linear models the mean and the linear predictor are identical. However, when dealing with counts and the distribution is Poisson, we must have the Poisson distribution parameter satisfy µi > 0 so that the identity link is less attractive, partly because ηi may be negative while µi > 0 must not be. It is advisable to utilize the log link η = log(µ) in this case. Similarly, when dealing with binomial distribution, the parameter p of probability of success in a single trial is restricted to be in (0,1) and the link function serves the purpose to map the interval (0,1) on to R1 . Therefore, links like the following (here µ is replaced by p):
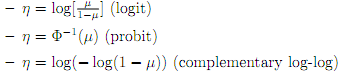
have been suggested and widely used.
Let us illustrate the most commonly met examples of GLM together with describing the types of response variable, distribution, and the link function:
- Traditional Linear Model:
i) response variable: continuous
ii) distribution: normal
iii) link function: identity : η = µ
- Logistic Regression:
i) response variable: probability ( µ)
ii) distribution: binomial
iii) link function: logit: η = log( µ/1-µ)
- Poisson Regression in Log Linear Model:
i) response variable: count
ii) distribution: Poisson
iii) link function: η = log(µ)
- Gamma model with Log Link:
i) response variable: a positive continuous variable
ii) distribution: Gamma
iii) link function: η = log(µ)
Intermezzo and history. If you read di?erent references, you may get confused about the terminology. You may have already come across the term "general linear model" in your introductory Statistics courses or in some reference books. Note, however, that this term refers to a conventional linear regression model for a continuous response variables given continuous and/or categorical predictors. It includes multiple linear regression, as well as ANOVA and ANCOVA. In SAS, such models are ?t by least squares and weighted least squares using (typically) proc glm. HOWEVER, the "generalized linear model" we are speaking about here, refers to the larger class discussed in this section. The ?rst widely used software package for ?tting these models was called GLIM. Because of this program, "GLIM" became a well-accepted abbreviation for generalized linear models, as opposed to "GLM". Since we clari?ed the confusion though, we will continue using "GLM" for generalized linear models since many recent references use it. Today, generalized linear models are ?t by many packages, notably by the SAS proc genmod. (End of intermezzo).
One of the advantages of the full probabilistic speci?cation of the GLM model is that ML Estimation suggests itself as a natural general estimation method. We have to maximize the log-likelihood
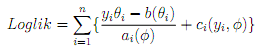
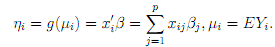
where β is linked to θ through the link function. Recall that the main parameter- vector of interest is β, the vector of regression coeffcients in the relation ηi = g(µi) = x0
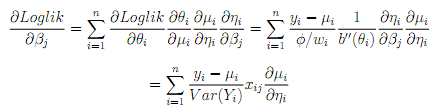
There is nowadays, with the availability of modern computing power, seldom any reason to consider estimators of β that are di?erent from the MLE. By using the chain rule, we get for the components of the score function:
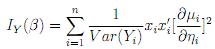
The (expected) Fisher information matrix is given then by
The ML Estimator is de?ned by equating the score function to zero. Numerically, the equation is solved by applying iterative procedures which we discuss next.