KEYNESIAN VIEW ON UNEMPLOYMENT
Keynes in his General Theory presented a view that fluctuations in aggregate demand (AD) influences the equilibrium level of output. Thus the economy is not necessarily at the full employment output level all the time and equilibrium can be realized at a level of output below full employment and corresponding to that level, part of the labour force remains unemployed. Recall that the Keynesian view emerged on the aftermath of the Great Depression when there was widespread unemployment in the economy accompanied by declining prices and output. At this point Keynes analysed the problem in the short run context and assumed that the aggregate supply (AS) curve is horizontal. It implies that AS is infinitely elastic and any level of output can be supplied without increase in prices so long as unemployment persisted. Keynes diagnosed the problem during the Great Depression to be a result of demand deficiency and suggested that AD should be increased, may be through increases in government expenditure. In fact, fiscal policy through appropriate designing of tax rates and government expenditure emerged as a major policy instrument largely due to the pioneering work of Keynes.
In Fig. we present an infinitely elastic AS curve and a downward sloping AD curve, the intersection of which provides us with equilibrium output (f) and prices (P*). In response to a decline in aggregate demand there is a downward shift in AD to ADI. Corresponding to this shift there is a decline in equilibrium output from (Y*) to (Y,'). Note that price level remains unchanged in the above model. In synchronization with the level of output, the quantity of labour used in production varies. For example, corresponding to a decline in equilibrium output the quantity of labour decreases. Simultaneously there is an increase in unemployment.
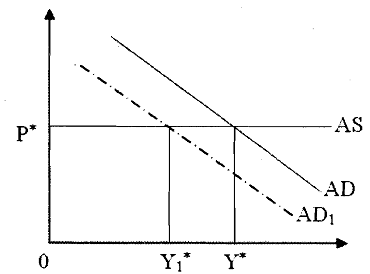
Fig. : Equilibrium Output in Keynesian Model
On the behaviour of wage rate, Keynes assumed that there is downward rigidity in nominal wage in the sense that workers oppose decline in the money wage, as they perceive it to be a decline in their income. During periods of recession when there is a decline in price level, real wage increases in spite of the fact that W nominal wage remains fixed. Recall that we defined real wage as w = - ; hence P decline in P would increase w when W is constant. The basic idea behind the simplest Keynesian model is that w varies inversely with P as W remains fixed. Thus in periods of boom, when there is an increase in prices, real wage tend to decline. Consequently, firms hire more labour and unemployment in the economy is lower.
In Fig. we discussed the extreme Keynesian case where AS curve is horizontal. On the basis of Keynesian ideas, economists analyse the unemployment issue by resorting to an upward sloping AS curve. As mentioned above, real wage falls when prices increase, as a result of which more labour is demanded. The outcome of such an increase is production of more output. Thus as price level increases we have increasing level of output, implying an upward sloping AS curve. The change in level of employment due to change in price level can be explained through the following diagram.
Fig. comprises three segments. In panel-a we have described a production hction such that corresponding to each level of output we can find out the level of employment. Thus when output produced is at full employment level (QJ we have corresponding level of employment at Lj In panel-b we plot the AS curve which depicts the output supplied (Q) at each price level (P). Thus when Qf is the output produced prevailing prices is Pj. In panel-c we depict real wage (W/P) on y-axis and employment level on x-axis. Note that we assume nominal rigidity in prices so that W is fixed. Thus real wage (w) increases as P decreases. Through the interaction of L, and Ld we have full employment (Lj) in the economy corresponding to real wage Wf W/Pj Thus we assume the initial position of the economy to be full employment corresponding to Qj; Lj, Pf and W/Pj
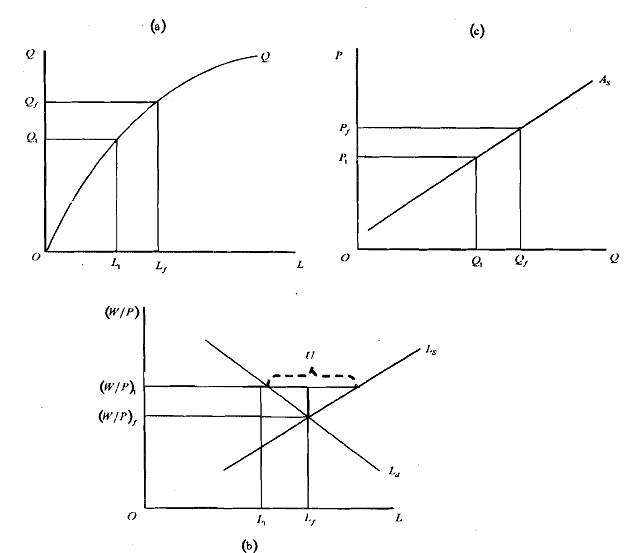
Suppose there is a decline in AD (not given in the figure). Consequen;ly, there is a decline in equilibrium output fiom QI to Ql and decline in prices fiom Pj to PI (see Fig. ). Corresponding to the new output level Ql, the level of employment is Ll, which is less then Lf. In fig. we see that a decrease in prices from P, to PI leads to an increase in real wage from W/P, to W/P1. At this level of real wage there is excess supply of labour compared to its demand. Thus unemployment to the extent 'U' (as shown in Fig. takes place.
In Fig. where we assumed the short run AS curve to be horizontal, upward shift in AD resulted in increase in output, keeping prices unchanged. In Fig. on the other hand, AS is assumed to be upward-sloping and shift in AD influenced both output and prices.
We observe that nominal wage is not completely sticky in an economy. Keynes in fact recognized that nominal wage would adjust to the requirement of labour market equilibrium. However, such adjustments would be too slow so that full employment may not prevail always. Adjustments in nominal wage in response to price changes is always with a lag. For example, if nominal wage adjusts in period 2 but prices increase in period 1, there is a decline in real wage in period 1. In period 2, however, nominal wage can be increased proportionately and real wage at the previous level be maintained. Salary indexation followed in India on a six-monthly basis is an example of such a lag in wage adjustments.