Illustrate the product life cycle, Project Management

Assignment Help:

Q. Illustrate the Product life cycle?

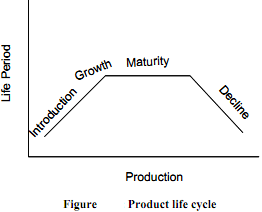
Every food product passes through different phases throughout its life and therefore, the need for development of a new product arises. Each product shows introduction, growth, maturity and decline during its period of existence. The various stages of product life cycle are shown in Figure.

2434_Stages of product life cycle.png

Let us review these phases in the product life cycle one by one.

1) Introduction phase

The introduction phase, as is evident in Figure, marks the launch of the product in the market.

2) Growth phase

Once the product crosses the introduction phase, it enters the growth phase. Generally, about 95% of the products fail at the introduction phase. Thus, a mere 5% are able to enter the growth phase. The growth phase involves strategy of product modification, enlarging distribution and maintaining a competitive price level. The strategy also involves one of extending product to different use situations and considering newer packaging alternatives to attract more and more new customers.

3) Maturity phase

Maturity phase is characterized by slowing of growth of sales and profits, as depicted in the Figure. It also sees a boom in the market demand as more and more customers are now willing to accept the product. This phase is also marked by strong competition.

4) Decline phase

Decline phase, as is evident from Figure, is the phase when sales decline because customer preferences have changed in favour of more efficient and better products. Customer's value perception of the product also undergoes a change. It leads to the gradual withdrawal of the product from the market.


Related Discussions:- Illustrate the product life cycle

Prepare a short notes on quality function deployment process, Question 1: ...

Question 1: Describe the concept of Cost of Quality briefly. What are the components of Cost of Quality? Concept of Cost of Quality Benefits Components of Cost

Operating characteristic curve, O perating characteristic curve The op...

O perating characteristic curve The operating characteristic curve for a sampling plan quantifies the risks. The OC curve for an attribute plan is a graph of the percentage de

Real life project, Real life project make as a project manager do it critic...

Real life project make as a project manager do it critical evolution 3000 words

When is employer not liable to pay compensation to employee, When is an emp...

When is an employer not liable to pay compensation to an employee? Compensation: An employer is not liable to pay compensation to an employee under the given circumstanc

What is the terminology used in mpmm, MPMM has adopted best practice termin...

MPMM has adopted best practice terminology to make sure that organizations communicate effectively whilst managing projects. Within the Glossary you will search definitions for all

Output analyzer, We used the output analyzer in order to compare the averag...

We used the output analyzer in order to compare the average waiting time spent in the urgent doctor queue in both the base model and alternative model 1 and between base model and

Outline at least three steps common to pert and cpm, QUESTION (a) Feasi...

QUESTION (a) Feasibility Study is a preliminary study undertaken before a real work of a project start what factors should the project manager take into consideration while con

How is a network diagram constructed, How is a network diagram constructed?...

How is a network diagram constructed? A network (critical path) diagram constructed by: • Needs a pencil, ruler and 2P coin or some stencil otherwise coin for an ideal circl

Write Your Message!

Captcha
Free Assignment Quote

Assured A++ Grade

Get guaranteed satisfaction & time on delivery in every assignment order you paid with us! We ensure premium quality solution document along with free turntin report!

All rights reserved! Copyrights ©2019-2020 ExpertsMind IT Educational Pvt Ltd