Minimization
Example
A farmer is advised to utilize at least 900 kg of mineral A and 1200 kg of mineral B to increase the productivity of crops in his fields. Two fertilizers, F1 and F2 are available at a cost of Rs.60 and Rs.80 per bag. If one bag of F1 contains 20 kg of mineral A and 40 kg of mineral B, and one bag of F2 contains 30 kg each of mineral A and B, then how many bags of F1 and F2 should the farmers use to fulfill the requirement of both the types of minerals at an optimum low cost?
Let us formulate this problem in terms of mathematical equations or inequalities. As the farmer has to decide on the number of bags of fertilizers F1 and F2, the variables may be defined as:
q1 = number of bags of F1
q2 = number of bags of F2
The objective function is minimization, that is, cost reduction. Here the total cost is 60q1 + 80q2. The restriction is that at least 900 kg of mineral A and 1200 kg of mineral B is required. Hence we get the following constraints:
20q1 + 30q2 > 900 - requirement for mineral A
40q1 + 30q2 > 1200 - requirement for mineral B
As we cannot have negative quantities, q1 > 0 and q2 > 0,
the problem may be represented as
Minimize Z : 60q1 + 80q2 .....(1)
Subject to constraints:
20q1 + 30q2 > 900
40q1 + 30q2 > 1200 .....(2)
q1 > 0, q2 > 0 .....(3)
We have to find the values of q1 and q2 which will satisfy constraints (2) and (3) and at the same time, minimize function (1).
After formulating the problem, each inequality is converted to an equality. Then any arbitrary value (say, 0) is assigned to one variable in the equation and the corresponding value of the other variable is found. Consider the constraints which are written as equalities: 20q1 + 30q2 = 900. If q1 = 0, we get q2 = 30 and if q2 = 0, we have q1 = 45. These two points are now plotted on a graph with q1 on X-axis and q2 on Y-axis. Joining the two points (0, 30) and (45, 0), we get a straight line corresponding to the above equation.
Consider the equation: 40q1 + 30q2 = 1200. If we take q1 = 0, then q2 = 40, and if q2 = 0, then q1 = 30. Joining the two points (0,40) and (30,0), we get another straight line corresponding to the above equation. The next step is to graph the feasible region which satisfies all the constraints. For this, we should take the co-ordinates of the point of origin (0,0) and substitute in each inequality. If the statement is found to be true, shade the region towards the origin or else shade the region away from the origin.
Take the constraint 20q1 + 30q2 > 900. If we substitute (0,0), we get (20 x 0) + (30 x 0) a ≥ 900. Since the statement is not true, we shade the region away from the origin. Similarly, for constraint 40q1 + 30q2 > 1200, we shade the region away from the origin.
Figure
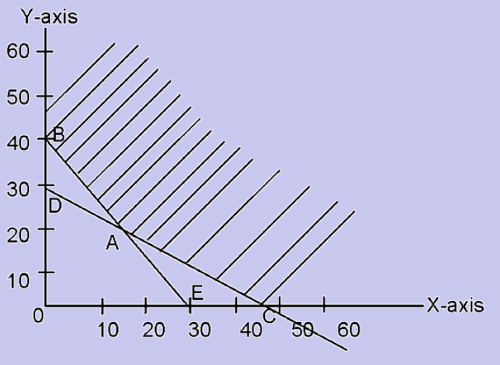
The region which satisfies all the constraints is the feasible region. Here, the region above ABC (that is, the intersection of all shaded regions) is the feasible region. Now we should compute the co-ordinates of the corner points B, A and C of the feasible region. We know that the co-ordinates of B are (0,40) and that of C are (45,0). For point A, which is an intersection of the two straight lines of equations 20q1 + 30q2 = 900 and 40q1 + 30q2 = 1200, we find the co-ordinates by solving the simultaneous equations
20q1 + 30q2 = 900 (1)
40q1 + 30q2 = 1200 (2)
Subtracting equation (1) from (2) we get 20q1 = 300. Therefore, q1 = 15 and q2 = 20. Hence the co-ordinates of A are (15,20).
The next step is to substitute the co-ordinates of the corner points of the feasible region in the objective function and choose the optimal solution (that is, the values that give the lowest cost).
We thus get the following volumes:
At A (15, 20), Z = 15 x 60 + 20 x 80 = Rs.2,500,
B (0, 40), Z = 0 x 60 + 40 x 80 = Rs.3,200 and
C (45, 0), Z = 45 x 60 + 0 x 80 = Rs.2,700
From the above calculations, we find that Z assumes a minimum value at A (15,20). Therefore, the optimal value of q1 = 15 and q2 = 20. Hence the farmer should buy 15 bags of fertilizer F1 and 20 of fertilizer F2 in order to meet the optimal requirements.