Q. Example to show the companys current gearing?
The company's current gearing
2000/ 8500 × 100 = 23.53%
The current gearing position is on the low side particularly when compared with the industry average of 35%. This offers an indication that the company still has the scope and capacity to attract more debt. There is nevertheless a large secured bank overdraft, and it is quite likely that quite a high proportion of it represents hard-core debt. It is as well most unlikely that the bankers would call in such a large overdraft at short notice. If the overdraft were included in the gearing calculation, and treated as debt, the gearing ratio 38.1% is a little above the industry average.
Current earning per share ($000)
EPS 3, 000/5,000= 60c per share
(ii) Issue of ordinary shares
Number of new shares =5,000,000/2= 2,500,000 shares
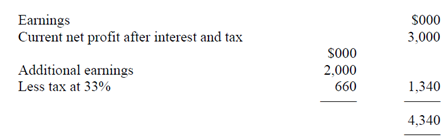
EPS 4,340/7,500= 58c per share
Gearing 2,000/13,500× 100 = 14.81%
More equity would reduce the gearing further. The gearing in the future would as well tend to fall due to increases in reserves via retained earnings.
The scheme would decrease the EPS by 2c per share when compared with current earnings. Other considerations which must be looked at are
?? The control factor that is those shareholders who currently control the company could lose control unless they buy some of the shares being offered.
(iii) 5% convertible loan stock
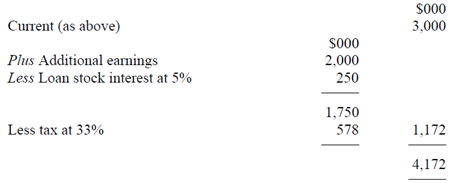
Undiluted EPS 4172/5000= 83c per share
The gearing at the time of issuing the convertible loan stock would be
7000/13500× 100 = 51.85%
This figure would be likely to decrease in future years as a result of ploughing back profits by way of retained earnings that are increasing the equity. On conversion the gearing percentage must fall quite significantly. This would be affected by means of the retained earnings new loans taken out and old loans paid off.
The completely diluted earnings per share that is where all the holders convert would be
Earnings $4340 as per scheme (i)
EPS 4340/7000 shares= 62c per share
For the period in which the holders can't or don't convert the undiluted EPS (provided earnings remain at this level and tax rates don't change) is much greater at 83c per share as indicated above. If and when the holders exchange a dilution of earnings will take place and the control of the company may be affected. If the interest rate is set the company would appear to have locked in to quite a low rate compared with the 7½% debentures that convertibles have a low service cost. The gearing would be well on top of the current industry average but on conversion would fall well below it.
(iv) 7½% debentures
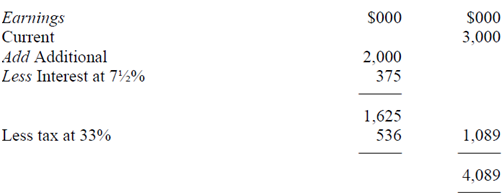
EPS =4089/5000= 82c per share
The EPS once more illustrates that using more debt that is becoming more highly geared can increase the earnings of the Ordinary Shareholders that is EPS 82c per share compared with current earnings of 60c per share. But the raise in gearing which would be higher than the industry average does place the increased risk of insolvency on the company. If trading circumstances are bad then the company still has to pay the interest on the debentures.