Equilibrium in both the goods and in the money market, Macroeconomics

Assignment Help:

Equilibrium in both the goods and in the money market 

If both the goods- and the money markets are to be in equilibrium...

...if P increases, Y must fall and R increase ...

...if P decreases, Y must increase and R fall

 For a given P, we can use IS and LM curves to find equilibrium values of interest rate and GDP. Though we can also determine how the equilibrium values of R and Y depend on P. 

2069_Equilibrium in both the goods and in the money market1.png

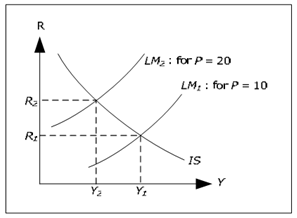
Figure: How P affects the equilibrium in the goods and money market

LM1 is the LM curve when P = 10, whereas LM2 is the LM curve when P = 20. LM2 is above LM1. If Y1 and R1 are the equilibrium values when P = 10 and Y2 and R2 are equilibrium value when P = 20, we see that Y2< Y1 and R2> R1.

We may draw the following conclusion. When prices increase, GDP should fall and interest rates should increase if both the goods and money market is to be in equilibrium. Economic intuition is something like following:

1. When P increases, demand for money increases 

2. When MD increases, interest rate increases

3. When R increases, investments fall 

4. When I falls, GDP falls

Of less significance is the following point: when GDP falls in step 4, MD will fall slightly - however not as much as it increased in step 1. So interest rate will decline slightly compared to the level in step 2.  

More significantly, we no longer have a unique equilibrium from money market and goods market.  As there is a unique LM curve for each value of P, there is an equilibrium (in both markets) for each value of P. 

The AD curve shows all combinations of P and Y where the goods and themoney markets are both in equilibrium. The AD curve slopes downwards.

From the section above, we know that Y should fall if P increases if we want both markets to remain in equilibrium. In this unit we derive the exact relationship between P and Y when both markets are in equilibrium. 

1124_Equilibrium in both the goods and in the money market.png

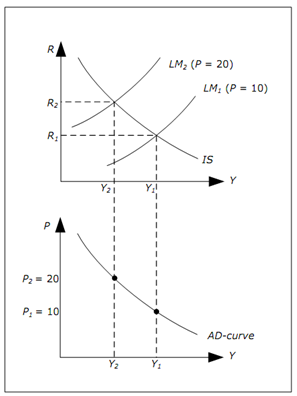
Figure: Derivation of the AD curve

We can explain our derivation using the diagram above.

1. First select P1 = 10 and P2 = 20 in the lower diagram.

2. Draw IS curve in the upper diagram and two LM curves - the one corresponding to P = 20 should be above the one for P = 10. 

3. Identify resulting GDP in the upper graph for both prices - the highest level of GDP is associated with lower of the prices. 

4. Extend these levels of GDP to lower graph. This will lead to two points in the lower graph. 

5. Keep on doing this with other prices. Resulting downward sloping curve in the lower graph is known as the AD-curve. 

Keep in mind that both goods market and money market is in equilibrium at all points on the AD curve. Thus AD-curve alone can't identify to which point the economy will move.


Related Discussions:- Equilibrium in both the goods and in the money market

What are the central bank overnight interest rates, What are the Central ba...

What are the Central bank overnight interest rates The overnight interest rate is an important interest rate for a central bank and it has methods of influencing this rate. In

Social entrepreneur is relying on contributions, If a social entrepreneur i...

If a social entrepreneur is relying on contributions, are there not risks in being accountable and using that money wisely?

Price results in the efficient quantity, The Price ceiling is the law that ...

The Price ceiling is the law that sets a maximum price below the equilibrium market price, but a price floor is the law that sets a maximum price above the market equilibrium price

Macroeconomic Analysis, Derive the conditions for steady state in the Solow...

Derive the conditions for steady state in the Solow model. What are its implications? In what respects is the golden rule different from the steady state?

Lagrangian of the consumer, This problem substitutes financial health with ...

This problem substitutes financial health with housing in a 2 period consumption savings model. The representative consumer has the utility function u(c1, c2) = lnc1 + lnc2 with ea

Balance between automation and labor, Businesses often decide between using...

Businesses often decide between using automation and labor in production. An automotive environment may have high fixed costs and low variable costs, and an industry that utilizes

Why gdp is determined only by aggregate demand, Q. Why GDP is determined on...

Q. Why GDP is determined only by aggregate demand? Note that we haven't said anything about the aggregate supply so far. In order to justify why GDP is determined only by aggre

Determine velocity approach to money demand, Determine Velocity Approach to...

Determine Velocity Approach to Money Demand. The Velocity Approach to Money Demand: The velocity of money: V = (P × Y)/ M The real quantity of money demanded is pr

Determine the appropriate interval-hypotheses , 1. Practice identification...

1. Practice identification of proper analysis type (1-Sample Z, 1-Sample t, 2-Sample t, Paired t, etc). 2. Practice hypothesis testing. 3. Practice interpretation of sta

Write Your Message!

Captcha
Free Assignment Quote

Assured A++ Grade

Get guaranteed satisfaction & time on delivery in every assignment order you paid with us! We ensure premium quality solution document along with free turntin report!

All rights reserved! Copyrights ©2019-2020 ExpertsMind IT Educational Pvt Ltd