This 24 year 1 quarter period should offer sufficient insight into the short term and long term correlation between the variables.
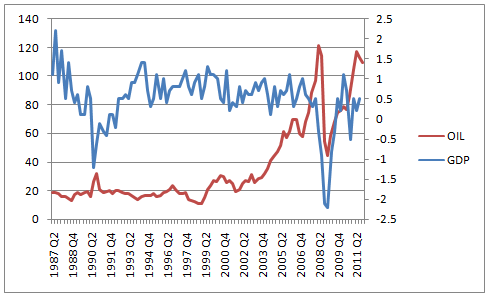
Figure - A graph showing the trend of GDP (primary y-axis) and Oil prices (secondary y-axis) throughout the sample period.
From the graph it can be seen that when the most notable oil price hike occurred in 2006, the rate of GDP subsequently decreased in the following periods. This could be completely coincidental. However this paper will aim to prove otherwise. There are signs from the graph that the relationship is bi-directional. Once oil prices peaked in 2008, the price subsequently decreased by 50% approx. This was immediately followed by periods of increase in the rate of GDP.
During this sample period, there have been two periods of recession. The first, during the early 1990's was thought to be caused by the savings and loans crisisin USA, when approximately 25% of the savings and loans organisations, failed according to the Federal Deposit Insurance Corporation (www.fdic.gov, 2002). The estimated cost of the bailout package neared $90 billion. This clearly impacted on the UK due to the interdependence of the two countries, resulting in negative GDP for 5 consecutive quarters (1990 Q3 à 1991 Q3).
The second recessionary period was the late 2000's, when the US housing bubble burst. This resulted in all mortgage backed securities, which were traded en masse between different financial institutions and valued highly, being actually worthless. This caused many major institutions such as Lehman Brothers to fail and the ramifications in the UK were: there was a dramatic squeeze on lending from financial institutions, leading to a vast reduction in available credit which led to a decline in manufacturing. (BBC News, 2009) This subsequently impactedunemployment (a 2.7% increase between 2008 Q1 and 2010 Q1) and finally a shrinkage of the UK economy for six consecutive quarters (2008 Q2 à 2009 Q3).
Between these periods, the UK has achieved stable growth. This corresponds with business cycle theory, where an economy will experience both peaks and troughs throughout the long term. It is interesting to observe the interest rates between these periods. During the 1990s recession, the average interest rate was 13%, whereas during the later recession the interest rate average was 2.5%. These rates are indicative of the nature of both recessions and the differences between the causes. During the sample period, inflation has only breached the 10% barrier for one period, and has maintained an average of 3.5%. This figure is higher than the current UK target of 2%, indicating that it has been difficult for the Bank of England to maintain price stability.