Dynamic changes in costs: the learning curve, Microeconomics

Assignment Help:

Dynamic Changes in Costs: The Learning Curve

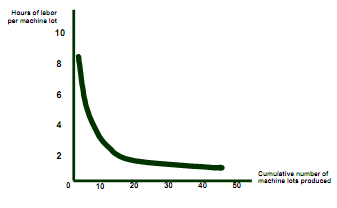
*  The learning curve measures impact of worker's experience on costs of production.

*  It describes relationship between a firm's cumulative output and amount of inputs required to produce a unit of output.

455_learning curve.png

2485_learning curve1.png

* If N=1

- L equals A + B and this measures labor input to produce the first unit of output

-   If β = 0

- Labor input remains constant as the cumulative level of output increases, cause there is no learning.

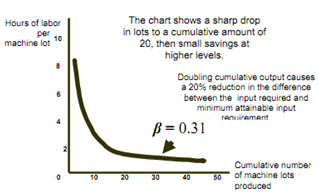
* If β > 0 and N increases

- L approaches A, and A represent minimum labor input unit of output after all learning has taken place.

-   The larger β:

- The more important becomes the learning effect.

404_learning curve2.png

* Observations

  1) New firms can experience learning curve and not economies of scale.

 2) Older firms have small gains from learning.

Economies of Scale Versus Learning

1650_learning curve3.png

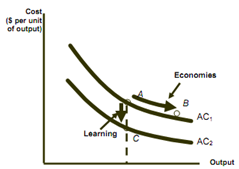
* The learning curve implies:

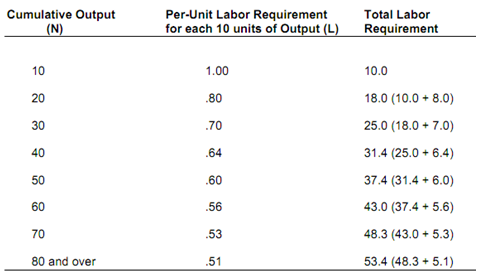
 1) The requirement of labor falls per unit.

 2) Costs will be high at 1st and then will fall with learning.

 3) After eight years the labor requirement will be 0.51 and per unit cost will be ½ what it was in the 1st year of production? 

653_learning curve4.png


Related Discussions:- Dynamic changes in costs: the learning curve

income and cross elasticities of demand, What are the income and cross ela...

What are the income and cross elasticities of demand?  Why might they be useful?  Explain.

Scarcity choice and opportunity cost, (a) Differentiate between a  command ...

(a) Differentiate between a  command economic system and a laissez-faire. (b) Assess to what extent it is advantageous for an economy when it moves from a controlled to a free-e

Key elements in micro enviroment, what are key elements in micro enviroment...

what are key elements in micro enviroment of red bull

Accompanying table , The accompanying table represents the price and yearly...

The accompanying table represents the price and yearly quantity sold of ice cream cones on Sidfield Island.   Price of Ice Cream Cones Quantity of Ice Cr

Marris model, what is the assumption of the model ?

what is the assumption of the model ?

Demand and Supply , Demand and supply curve for french breads

Demand and supply curve for french breads

Why a high level of labor force growth is correlated, Why a high level of l...

Why a high level of labor force growth is correlated A high level of labor force growth is correlated--even though less powerfully--with a low level of output per worker. The a

Mass, what is the mass of a body when it is taken to the moon

what is the mass of a body when it is taken to the moon

Break-even point, How to I calculate the break-even point per unit in dolla...

How to I calculate the break-even point per unit in dollar amount and then determine whether there will be a profit or loss? Such as if the fixed costs were $75000. The variable co

Write Your Message!

Captcha
Free Assignment Quote

Assured A++ Grade

Get guaranteed satisfaction & time on delivery in every assignment order you paid with us! We ensure premium quality solution document along with free turntin report!

All rights reserved! Copyrights ©2019-2020 ExpertsMind IT Educational Pvt Ltd