Develop system flow charts - nasa near earth object, Computer Engineering

Assignment Help:

Background Information

The National Aeronautics and Space Administration (NASA) is the agency within the United States Government responsible for US space exploration. Within the NASA there are programs not directly associated with manned space activity. One of the most recently funded initiatives is the tracking and monitoring of Near Earth Objects (NEOs).  

NEOs are comets and asteroids that have been nudged by the gravitational attraction of nearby planets into orbits that allow them to enter the Earth's neighborhood.   

Composed mostly of water ice with embedded dust particles, comets originally formed in the cold outer planetary system. The giant outer planets (Jupiter, Saturn, Uranus, and Neptune) formed from an agglomeration of billions of comets and the left over bits and pieces from this formation process are the comets we see today.    

Likewise, today's asteroids are the bits and pieces left over from the initial agglomeration of the inner planets that include Mercury, Venus, Earth, and Mars.  So most of the rocky asteroids formed in the warmer inner solar system between the orbits of Mars and Jupiter.   

A new scientific interest in comets and asteroids is due to recent research indicating that an "event" (a NEO that may collide with the Earth) could likely occur anytime within the next few hundred years  The Jet Propulsion Laboratory (JPL) located at California Institute of Technology (CalTech) near Pasadena, California, has been given the budget for the NEO program, although the program spans the entire globe and many scores of scientists.  

The Project

You are a scientist at the JPL and you have been given project responsibility for analysis of NEOs for the purpose of developing an Early Warning System (EWS). You have an extract of the JPL NEO Database of 10,972 close-Earth approaches sorted by date, occurring on or after 2013-Feb-14 UT through 2200-Dec-24 UT. (Only those close approaches within 0.1 AU are included). This is actual NEO data from JPL; and we have extracted the data to a comma delimited text file (NEO.txt) file for ease of use. 

The data elements in the extract (NEO.txt) are as follows:
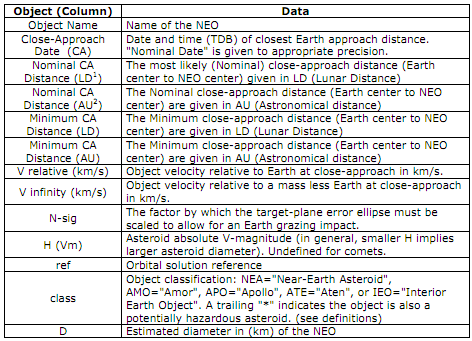
81_Develop System Flow Charts - NASA Near Earth Object.png


1. (LD) Lunar Distance: 1.0 LD is about 3.84x10^5 km or 0.00257 AU (the average distance between the Earth and the Moon).

2. (AU) Astronomical distance Unit: 1.0 AU is about 1.5x10^8 km (roughly the average distance between the Earth and the Sun).

Some of the fields that are in the data extract will not be used in this Examination.

TASKS TO PERFORM PER SPECIFICATION   

A. Define all methods, structs, classes, and any data file that you create or use including their relationships and attributes. 

B. Develop System Flow Charts and functional flow charts of each function

C.  Program your system entirely in ANSI C.


Related Discussions:- Develop system flow charts - nasa near earth object

Average enzyme activity , Activity of a some  enzyme was calculated  in ext...

Activity of a some  enzyme was calculated  in extracts from brain, heart and lung. In every  tissue,  the activity was calculated  various  times, giving the following results (in

Is the address bus unidirectional, The address bus is unidirectional due to...

The address bus is unidirectional due to the address information is always given by the Micro Processor to address a memory location of an input or output devices.

Cache memories - computer architecture, Cache Memories - computer architect...

Cache Memories - computer architecture: Speed of the primary memory is very low in comparison with the speed of processor For well performance, the processor can't spend

Explain biometric systems, Explain Biometric Systems Biometrics is the ...

Explain Biometric Systems Biometrics is the science of measuring physical properties of living beings. Biometric Authentication (1) Biometric authentication is the aut

What is the difference between activity and sequence diagram, The following...

The following are the difference among Activity and Sequence Diagrams: A sequence diagram represents the way of processes implement in a sequence. For example, the order of op

Homework, Use linear activation function and Hebbian learning for a SLFF ne...

Use linear activation function and Hebbian learning for a SLFF network to attempt to learn the following two sets of patterns. Why can the patterns be learned, or why can they not

Discuss on wbmp, Question 1 How to call a WML Script from a WML page Q...

Question 1 How to call a WML Script from a WML page Question 2 Discuss on the following WML Script data type Question 3 Discuss on the following WML script statements

State about the multiple inheritance, State about the multiple inheritance ...

State about the multiple inheritance multiple inheritance is shown in Figure. In this, one class is inherited from more than one class.

Advantages and disadvantages of structured analysis, Advantages and Disadva...

Advantages and Disadvantages of Structured Analysis With time, you will find out that most customers understand structured methods better than object oriented (OO) methods. As

Write Your Message!

Captcha
Free Assignment Quote

Assured A++ Grade

Get guaranteed satisfaction & time on delivery in every assignment order you paid with us! We ensure premium quality solution document along with free turntin report!

All rights reserved! Copyrights ©2019-2020 ExpertsMind IT Educational Pvt Ltd