Determine the hypothesised value, Basic Statistics

Assignment Help:

Read Confidence Intervals and P-values in Section C of your Lecture Workbook or on Cecil under Assignment Resources. Consider a study to determine ways the response rate in surveys can be improved. Two types of approaches are under consideration - telephoning prior to mailing out or not telephoning prior to mailing out the survey questionnaire. Telephoning people would create additional expenses. Therefore the question is, does telephoning people prior to mailing out the survey questionnaire have a beneficial effect on the response rate? In addition, market research companies consider that a difference in response rate of less than 8% would be of no consequence, whereas a difference of 8% or more could result in considerable benefits. Some possible outcomes of the study are:

2147_What is the hypothesised value.png

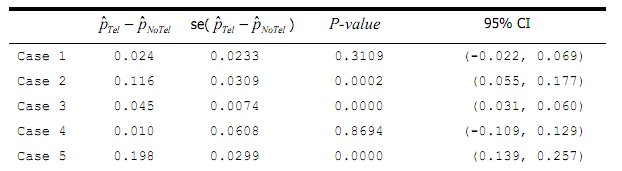
Notes: 1. PTel - PNoTel = the difference between the true proportion of people who would respond to the survey having received a telephone call (PTel ) and the true proportion of people who would respond to the survey having not received a telephone call (PNoTe).

2. The hypotheses associated with the quoted P-values are:

H0 : PTel - PNoTel = 0 vs H1 : PTel - PNoTel ≠ 0

(a) (i) What is the hypothesised value?

(b) Which case(s) demonstrates, at the 5% level, that the difference in the sample proportions between the response rates for the two survey approaches, , is statistically significant?

(c) For which case(s) are we able to claim that the underlying difference between the response rates for the two survey approaches:

(i) is clearly big enough to have practical significance?

(ii) is too small to have practical significance?


Related Discussions:- Determine the hypothesised value

Permutation, Find the number of different ways in which the 9 letters of th...

Find the number of different ways in which the 9 letters of the word GREENGAGE can be arranged if exactly two Gs are next to each other?

Graph, what is the difference between histogram and historigram

what is the difference between histogram and historigram

Hypotheses- sampling methodology or data collection design, Research Assign...

Research Assignment for Quantitative Methods 2 Purpose: To design, undertake and analyse research on a negotiated project, possible themes could be any one of the following:

Describe the statistical results, Q1. A software developer is interested in...

Q1. A software developer is interested in finding what the best color theme should be for an engine diagnostic program for the flight line. He is considering three different color

Domain, select and list five items used to sample the domain in childhood o...

select and list five items used to sample the domain in childhood obesity

Sampling, Advantages of sampling over population

Advantages of sampling over population

Online homework, I need help with online accounts homework.

I need help with online accounts homework.

Correlation and regression, The square of the sample correlation coefficien...

The square of the sample correlation coefficient is typically denoted r2 and called the coefficient of determination. It estimates the fraction of the variance in Y that is explain

Analysis and interpretation business report, Case Study. Using the data, pr...

Case Study. Using the data, prepare a report that analyses the profitability, liquidity and solvency of a Accessorize Pty Ltd and help the owner to decided whether to purchase the

Write Your Message!

Captcha
Free Assignment Quote

Assured A++ Grade

Get guaranteed satisfaction & time on delivery in every assignment order you paid with us! We ensure premium quality solution document along with free turntin report!

All rights reserved! Copyrights ©2019-2020 ExpertsMind IT Educational Pvt Ltd