Determination of all the endogenous variables, Macroeconomics

Assignment Help:

Q. Determination of all the endogenous variables?

Determination of all the endogenous variables in the AS-AD model

Determination of P and Y:

Prices and GDP are in equilibrium when aggregate supply is equal tothe aggregate demand in the AS-AD model

We know that for all points on AD curve, both the money market and goods are in equilibrium.

We also know that firms would always produce an amount consistent with the AS-curve. 

1324_Determination of all the endogenous variables.png

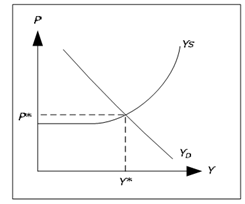
Figure: Determination of P and Y in the AS-AD model

There is only one level for P and for Y that is consistent with equilibrium in both markets and which is consistent with firm behaviour. Price level at this point is the equilibrium price level and GDP level at this point is the equilibrium quantity of GDP. We refer these levels by P* and Y*.

AS-AD model, P will always move towards P* and Y would always move towards Y*. To justify this behaviour of economy, let's consider what will happen if P < P*. 

1. From the graph, we see that in this case YS< YD

2. As we are on the upward sloping part of the AS-curve, aggregate supply won't automatically increase. But as firms can sell everything they produce and since stocks are diminishing, they will raise prices. 

3. When P increases, real wages W/P falls and L increases. With more labor, firms can increase production. 

4. When P increases, demand for money will increase. Then interest rates will increase and YD will fall (LM-curve shifts upwards). 

5. Overall, YD falls and YS increases when P increases. As long YS< YD, firms would continue to raise prices. So prices will continue to increase till YS = YD and economy is in equilibrium.


Related Discussions:- Determination of all the endogenous variables

Why do some countries have a low real per capita income, Why do some countr...

Why do some countries have a low real per capita income? Low real per capita income considers being largely due low productivity (i.e., output per worker) of low valued added

Average price of a textbook, The demand for textbooks is Q=200-P+25U-50Pbee...

The demand for textbooks is Q=200-P+25U-50Pbeer. Assume that the unemployment rate U is 8 and the price of beer P beer is $2. When the average price of a textbook is P=$100, the el

Expenditures and the effects of fiscal policy, Expenditures and the Effects...

Expenditures and the Effects of Fiscal Policy are stated as follows: Having finished the discussion on the tax policy and taxation, now let’s us focus on expenditures and the e

The world economy , The financial crisis that hit the United States first a...

The financial crisis that hit the United States first and then the world economy starting in fall 2007 meant that the future prospects of many firms looked gloomy at best for some

Central bank, how can a central bank diminish inflation

how can a central bank diminish inflation

Quantity of twinkies demanded increases, Suppose the price of Twinkies decr...

Suppose the price of Twinkies decreases from $1.45 to $1.25 and, as a result, the quantity of Twinkies demanded increases from 2,000 to 2,200. Using the midpoint method, the price

Explain about nominal wage level, Q. Explain about Nominal wage level? ...

Q. Explain about Nominal wage level? In macroeconomics, we are usually not interested in the wage for a specific individual though in the average wage for all employed individu

Describe how exchange rate is expressed, Describe how exchange rate is expr...

Describe how exchange rate is expressed in some nation In some nations, exchange rate is expressed using home currency as base currency. In UK for instance, Danish exchange rat

Governors of the federal reserve system, You should now find a press releas...

You should now find a press release from the Board of Governors of the Federal Reserve System, dated December 16, 2009, which discusses the decisions of the Federal Open Market Com

Graph, Maximum profits will occur at the output level where is the greatest...

Maximum profits will occur at the output level where is the greatest vertical distance between Total Revenue(TR) AND Total Cost(TC. uSE THE TOTAL REVENUE-TOTAL COST CURVES TO Illus

Write Your Message!

Captcha
Free Assignment Quote

Assured A++ Grade

Get guaranteed satisfaction & time on delivery in every assignment order you paid with us! We ensure premium quality solution document along with free turntin report!

All rights reserved! Copyrights ©2019-2020 ExpertsMind IT Educational Pvt Ltd