Cournot duopoly model, Econometrics

Assignment Help:

i) Briefly distinguish between the Cournot duopoly model and that of Stackelberg.    

ii) Suppose the  inverse  market demand curve for  a telecommunications equipment is P = 100 - 2Q. Suppose there are two firms with constant marginal cost $4. Assuming they behave as Cournot duopolists, what will be the price and total industry output?

iii)  The inverse market demand curve for a Stackelberg leader and follower is given by  P =  30  - Q. If each has a marginal cost of $2, what will be the equilibrium quantity and price for each producer?

iv) Two firms, A and B, are operating in the US market  industry under duopolistic condition and choose to either produce at "High" price or a "Low" price. Suppose you are the manager of  firm A and you are required to advise the Board of Directors about the following strategic options:

1252_Cournot duopoly model.png

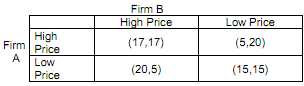
a.  If Firm B chooses High Price, what is Firm A's best strategy and why? 

b.  If Firm A chooses Low Price, what is Firm B's best strategy and why?

c.  What is the Nash equilibrium? Explain.

d.  What measures could you adopt to convince Firm B that you will abide to the agreement?

e.  Suppose that both firms produce at "Low" price and each firm make a loss of 16.


Related Discussions:- Cournot duopoly model

Auto correlation, if there is no autocorrelation what will be done

if there is no autocorrelation what will be done

Expected values and variances, What is the expected value and variance of y...

What is the expected value and variance of y = 3x+2 knowing that E(X) = 8 and var(X) = 4.

Probability distribution function, Assume the following table gives the joi...

Assume the following table gives the joint PDF (probability distribution function, not Adobe document!!) of two discrete variables, x and Y.                                  Vari

Impulse Response function (IRF), My question is that when we use Impulse re...

My question is that when we use Impulse response function and how to use it. Is it used along with some other methodology. What is the meaning of graphs of IRF?

#title.MULTICOLINEARLITY, HOW TO USE CORRELATION OF THE OFF DIAGONAL ELEMEN...

HOW TO USE CORRELATION OF THE OFF DIAGONAL ELEMENTS OF THE COVARIANCE MATRIX TO DETECT MULTICOLINEARLITY

Project, QM2 Econometric Project As part of the course requirements you hav...

QM2 Econometric Project As part of the course requirements you have to undertake an econometric evaluation of an economic issue using data that you have gathered either from the ho

Demand analysis, demand analysis of fast food among civil servant

demand analysis of fast food among civil servant

#simultaneously, #question.Suppose that you have 150 observations on produc...

#question.Suppose that you have 150 observations on production (yt) and investment (it), and you have estimated the following ADL(3,2) model: (1 – 0.5L – 0.1L2 – 0.05L3)yt = 0.7 +

Wooldridge text book, The following table contains the ACT scores and the G...

The following table contains the ACT scores and the GPA (grade point average) for eight college students. Grade point average is based on a four-point scale and has been rounded to

Write Your Message!

Captcha
Free Assignment Quote

Assured A++ Grade

Get guaranteed satisfaction & time on delivery in every assignment order you paid with us! We ensure premium quality solution document along with free turntin report!

All rights reserved! Copyrights ©2019-2020 ExpertsMind IT Educational Pvt Ltd