Cost-Volume-Profit Analysis
The Cost-Volume-Profit (CVP) analysis provides answers to vital questions such as: At what sales volume would the firm break-even? How sensitive is the profit to variations in output? How sensitive is the profit to variations in selling prices? What should be the sales level in quantity terms for the firm to earn the target level of profits?
One basic assumption of CVP analysis is that all costs could be segregated into fixed and variable, and costs which are of a semi-fixed or semi-variable nature could be segregated into the fixed and variable components.
The method of simple linear regression is commonly used to segregate the fixed and variable components of semi-fixed or semi-variable costs. The illustration given below explains the application of regression technique in CVP analysis.
Example
The following table gives the repairs and maintenance cost incurred in a cost center for various levels of annual production.
|
Output
(in thousands of units)
|
Repairs and Maintenance Cost Rs.(in thousands)
|
|
|
1.0
|
15
|
|
2.0
|
21
|
|
2.5
|
24
|
|
3.0
|
26
|
|
3.5
|
29
|
|
4.0
|
32
|
|
5.0
|
36
|
|
6.0
|
40
|
|
7.0
|
44
|
|
8.0
|
49
|
|
If the budgeted production of the cost center in the forthcoming year is 8500 units, what would be the estimated repairs and maintenance cost ignoring possible increase in price levels?
In order to segregate the repairs and maintenance cost into fixed and variable components and to forecast the estimated cost at a production level of 8,500 units, first of all, the estimating linear regression equation of the form Y = a + bX must be determined. In this equation, Y is the estimated total cost of repairs, 'a' is the fixed component of the total cost, 'b' is the variable component per unit of production and 'X' is the volume of production sought to be achieved.
In order to determine the estimating equation, the following table should be set up.
|
X
|
Y
|
XY
|
X2
|
|
|
1
|
15
|
15
|
1
|
|
2
|
21
|
42
|
4
|
|
2.5
|
24
|
60
|
6.25
|
|
3
|
26
|
78
|
9
|
|
3.5
|
29
|
101.5
|
12.25
|
|
4
|
32
|
128
|
16
|
|
5
|
36
|
180
|
25
|
|
6
|
40
|
240
|
36
|
|
7
|
44
|
308
|
49
|
|
8
|
49
|
392
|
64
|
|
|
Total 42
|
316
|
1544.5
|
222.5
|
|
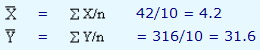
We know that,
| b |
= |
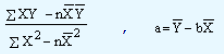 |
|
|
From the table, we know that
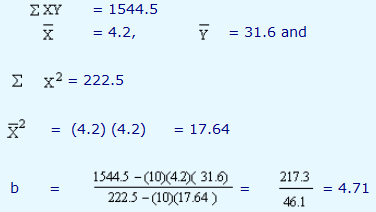
a = 31.6 - (4.71)(4.2) = 11.818
Since 'a' the intercept represents the fixed cost, at any volume of production the fixed cost is Rs.11,818. The variable repairs and maintenance cost is Rs.4.71 per unit produced.
For a budgeted production of 8,500 units, the estimated repairs and maintenance cost will be as follows:
|
|
Rs.
|
|
Fixed Component
|
11,818
|
|
Variable Component (8,500 x 4.71)
|
40,035
|
|
Total
|
51,853
|
While budgeting this figure it may be approximated to Rs.52,000.