Matlab Command Reference
1. Getting Help:
The help command is used to find the functions and its syntax. Similarly, lookfor is used to find the functions or topics. For example:
help power
Another example:
lookfor integration
2. Arithmetic Equations:
+,-,* and / are the arithmetic operators. These operators are used in arithmetic expression.+ meansaddition, - meanssubtraction,* meansmultiplication and/ means division.
For example:
» 5+6/4*2-6
ans = 2
3. Accuracy of Operations:
The eps(x)function used to set the accuracy of floating number. For example:
» eps(4)
» power(sqrt(2),2)-2
ans = 4.4409e-016
4. Order of operations:
BEDMAS means Bracket, Exponential, Division/Multiplication and Addition/Subtraction. It is very important in arithmetic operations. For example:
» 5+6/4*2-6
ans = 2
5. Trigonometric Functions:
Sin(x),cos(x), tan(x) and so on are the trigonometric functions.
» tan(45*pi/180)
ans = 1.0000
Here 45 numbers is converted into 45 degree.
6. Exponential and log functions:
exp(x) is the exponential of the elements of x, e to the x.
For complex Z=X+i*Y, EXP(Z) = EXP(X)*(COS(Y)+i*SIN(Y)).
log(x) is the natural logarithm, log10(x)is the base 10 logarithm. For example:
» exp(3)
ans = 20.0855
» log10(10)
ans = 1
7. Vectors:
A Matlab vector is list of values which can be used in function evaluations or arithmetic expressions. For example:
» x=[1:0.5:3]
x = 1.0000 1.5000 2.0000 2.5000 3.0000
Start Value=1
Step Value=0.5
Stop Value=3
8. Vector Arithmetic:
To perform element by element multiplication and division, use "dotted" operators. For example:
» x=[3:0.2:4]
x = 3.0000 3.2000 3.4000 3.6000 3.8000 4.0000
» y=[2:0.5:4.5]
y = 2.0000 2.5000 3.0000 3.5000 4.0000 4.5000
» x.*y
ans = 6.0000 8.0000 10.2000 12.6000 15.2000 18.0000
9. Plotting vectors:
The plot command is used to make x-y plots. For example:
» x=[3:0.2:4]
x = 3.0000 3.2000 3.4000 3.6000 3.8000 4.0000
» y=[2:0.5:4.5]
y =2.0000 2.5000 3.0000 3.5000 4.0000 4.5000
» plot(x,y)
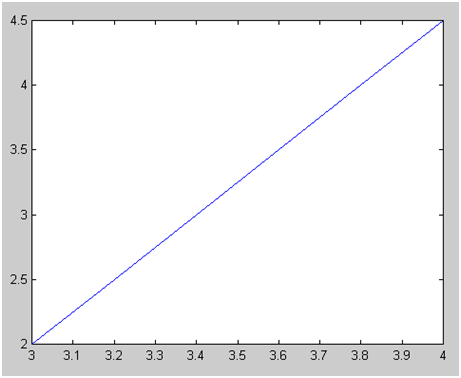
Figure: Plot a line graph of two vector values
10. Printing the Plots
» print('-djpeg','Lab1.jpeg')
This command is used to convert the plot into jpeg picture format.
11. 3D Plots
The above plots are two dimensional graphics. Now we study about the three dimensional graphics.
z=peaks(25);
mesh(z);
12. Data Type Conversion
These types of functions are used to convert from one data type to another one. For example:
q=5;
title(['Area = ',num2str(q)]);
ans Area=5
13. Limit the Decimal Part
Round function is used to round towards nearest integer. Similarly Floor, Ceil and Fix functions are also related to Round function. For example:
x =2.4455
» round(x)
ans = 2
14. Square and Power Functions
sqrt(x)function is used to calculate the square root the value of x. Similarly,the power function is used to calculate the power of the value of x. For example:
» a=30
a = 30
» sqrt(a)
ans = 5.4772
» power(a,1/2)
ans = 5.4772
15. Conversion
If we need to change from decimal to binary or decimal to octal we use bin2dec and dec2binfunctions. For example:
» dec2bin(5)
ans = 101
» bin2dec('101')
ans = 5