Cartesian graph of density of water - temperature, Mathematics

Assignment Help:

Cartesian Graph of Density of Water - Temperature:

Example: The  density  of  water  was  measured  over  a  range  of  temperatures.   Plot the subsequent recorded data on a Cartesian coordinate graph.

Temperature (°C)                                                       Density (g/ml)

40°                                                                                0.992

50°                                                                                0.988

60°                                                                                0.983

70°                                                                                0.978

80°                                                                                0.972

90°                                                                                0.965

100°                                                                              0.958

To plot the data the first step is to label the x-axis and the y-axis. Let the x-axis be temperature in °C and the y-axis is density in g/ml.

The further step is to establish the units of measurement along every axis. The x-axis must range from approximately 40 to 100 and the y-axis from 0.95 to 1.00.

The points are then plotted one by one.  Below figure shows the resulting Cartesian coordinate graph.

2408_Cartesian Graph of Density of Water - Temperature.png

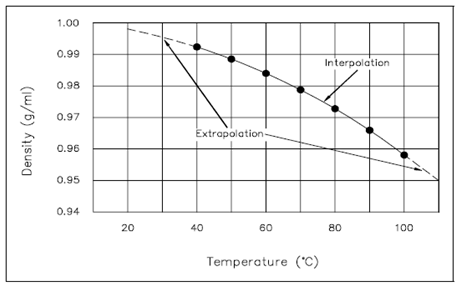
Figure: Cartesian Coordinate Graph of Density of Water vs. Temperature

Graphs are convenient since, at a single glance, the main features of the relationship among the two physical quantities plotted can be seen.  Further, if some previous knowledge of the physical system under consideration is available, the numerical value pairs of points could be connected through a straight line or a smooth curve. From these plots, a values at points not specifically measured or calculated can be acquired.  In Figures, the data points have been connected through a straight line and a smooth curve, correspondingly.  From these plots, the values at points not particularly plotted can be determined. For instance, using Figure, the density of water at 65°C can be determined to be 0.98 g/ml.  Because 65°C is within the scope of the available data, it is known as an interpolated value.   Also using Figure, the water density at 101°C can be estimated to be 0.956 g/ml.  Because 101°C is outside the scope of the available data, it is known as an extrapolated value.  While the value of 0.956 g/ml appears reasonable, a significant physical fact is absent and not predictable from the data given.  Water boils at 100°C at atmospheric pressure.  At temperatures above 100°C it is not a liquid, but a gas.  Thus, the value of 0.956 g/ml is of no importance except when the pressure is above atmospheric.

This describes the relative ease of interpolating & extrapolating using graphs. It also points out the precautions which must be taken, namely, extrapolation & interpolation should be done only if there is some prior knowledge of the system. That is particularly true for extrapolation where the available data is being extended into a region whereas unknown physical changes may take place.


Related Discussions:- Cartesian graph of density of water - temperature

Trigonometric approximation grid, With a compass draw the arc associated wi...

With a compass draw the arc associated with a 720° angle, it looks like a circle. With a protractor, label the angle in multiples of 45° and 30° up to 720°.  Notice 30° and 390° ar

Differential equations, Verify Liouville''s formula for y "-y" - y'' + y = ...

Verify Liouville''s formula for y "-y" - y'' + y = 0 in (0, 1) ?

Xy Algebra, Find the values of x and y

Find the values of x and y

Example of least common denominator, Example of Least Common Denominator: ...

Example of Least Common Denominator: Example: Add 1/7 +2 /3 + 11/12 + 4/6 Solution: Step 1:             Find out primes of each denominator. 7 = 7 (already is

Describe the sample of exponents , Describe the Sample of Exponents ? I...

Describe the Sample of Exponents ? Imagine, for example, that you are the P.E. coach at your school, and you need to divide one of your classes into teams. Your team has 45 stu

Find the area of the rhombus, Show that the points (3, 0), (4, 5), (-1, 4) ...

Show that the points (3, 0), (4, 5), (-1, 4) and (-2, -1) taken in order are the vertices of a rhombus. Also find the area of the rhombus.

Chi-square hypothesis tests as non-parametric test(x2), Chi-square hypothes...

Chi-square hypothesis tests as Non-parametric test(X2) They contain amongst others i.    Test for goodness of fit ii.   Test for independence of attributes iii.  Test

Write Your Message!

Captcha
Free Assignment Quote

Assured A++ Grade

Get guaranteed satisfaction & time on delivery in every assignment order you paid with us! We ensure premium quality solution document along with free turntin report!

All rights reserved! Copyrights ©2019-2020 ExpertsMind IT Educational Pvt Ltd