Build a single phase model for the simple 3-phase system, MATLAB Programming

Assignment Help:

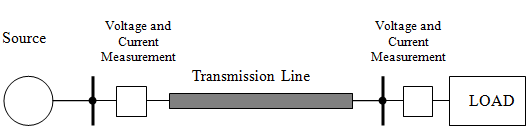
Build a single phase model for the simple 3-phase system shown in the single line diagram shown below using SimPowerSystems in MATLAB Simulink.
2136_Build a single phase model for the simple 3-phase system.png

Data:

Source Voltage = 100kV (Peak voltage), Frequency = 50Hz

Source Impedance:

Resistance = 0.1Ω, Reactance = 1.5Ω

Transmission Line:

Length = 50km, Resistance = 0.05Ω/km, Reactance = 0.3Ω/km, Capacitance = 5.0nF/km

Load:

Real power P = 40MW, Reactive Power Q = 30MVar, Load Voltage = 100kV

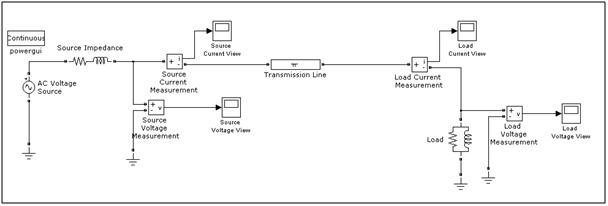
Single phase model in SimPower:
517_Build a single phase model for the simple 3-phase system1.png


Analysis:

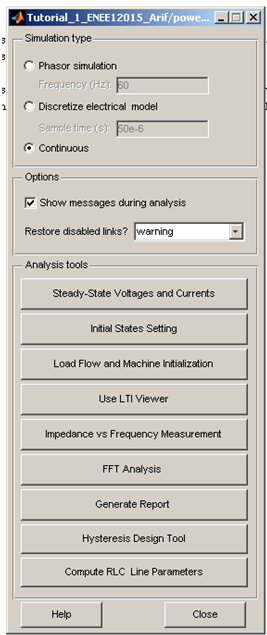
By clicking the "Powergui" block you will get the analysis tools.
286_Build a single phase model for the simple 3-phase system2.png

Report:

By clicking the "Generate report" you will be able to produce required report of the analysed model.

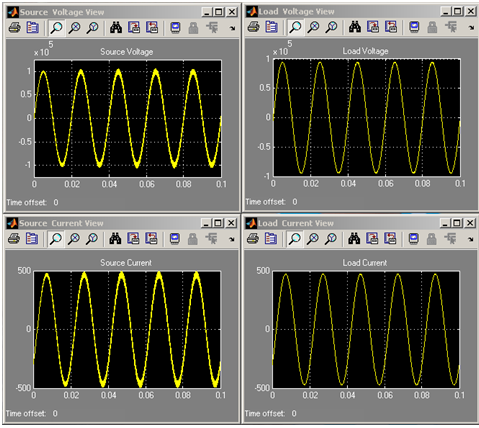
For 0.1 second simulation time (i.e. set stop time to 0.1 sec) and for one PI Section block we will observe voltage and current waveforms in the source side and load side as follows:
1837_Build a single phase model for the simple 3-phase system3.png

Change the PI section number, use series R-L load and observe the changes in the voltage and current waveforms.


Related Discussions:- Build a single phase model for the simple 3-phase system

Basic algebra, how to find absolute value of a number

how to find absolute value of a number

Plot the intensity distribution - numerical techniques, Using numerical tec...

Using numerical techniques, plot the intensity distribution for LP 01 and LP 11 modes. Vary the value of V (reduce it to 1.5) and plot several of the intensity plots (of LP 01 )

Portfolio selection problem, An individual with $10,000 to invest has ident...

An individual with $10,000 to invest has identi?ed three mutual funds as attractive opportunities. Over the last ?ve years, dividend payments (in cents per dollar invested) have be

Illustrations of calling the rand function, Illustrations of calling the ra...

Illustrations of calling the rand function: The function ‘rand’ can be used to produce random real numbers; calling it produces one random real number in the range from 0 to

Sum of two numbers, write the program sum of two numbers using matlab code

write the program sum of two numbers using matlab code

Find the total per phase inductance and per phase shunt, A 300 km, 3-phase,...

A 300 km, 3-phase, 50Hz transmission line has spacing as shown in Figure 2. Each phase of the line consists of a bundle of three conductors.  (a) Find the total per-phase induct

Plot modulation schemes using mathlab, Plot way forms for the following mod...

Plot way forms for the following modulation schemes using Mathlab: a)      2 ASK                     b)  BFSK                        c) BPSK 4 ASK

Find the spectrum of waveform, (a) Find the spectrum of this waveform:  x =...

(a) Find the spectrum of this waveform:  x = [ exp( -[0:1:49]/10), exp(-[50:-1:1]/10)]. Subplot only the magnitude by using the spectrum program from the class notes. (b) Using

Looping statements, Looping Statements: Consider the problem of comput...

Looping Statements: Consider the problem of computing the area of a circle with radius of 0.3 centimeters-a MATLAB program certainly is not required to do that; you would use

Write Your Message!

Captcha
Free Assignment Quote

Assured A++ Grade

Get guaranteed satisfaction & time on delivery in every assignment order you paid with us! We ensure premium quality solution document along with free turntin report!

All rights reserved! Copyrights ©2019-2020 ExpertsMind IT Educational Pvt Ltd