Adaptive filters can also be used in other applications. Speech recognition, for example, is performed in a non-stationary environment, and therefore may require adaptive filtering. Consider first the structure shown in Figure which consists of two separate parts. The first synthesizes a signal from white noise, using an autoregressive model, and the second adapts its coefficients so as to recreate the initial signal.
Figure: Synthesis and Analysis Structure for an AR Model
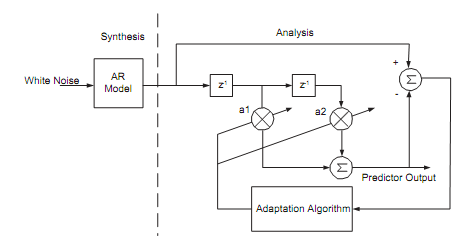
- Write a program to implement the above network and use an AR model with a=[1 0.9 0.2]; if the adaptation algorithm works well 1 and 2 should converge to -0.9 and -0.2 respectively; explain this result.
- Test your program and observe the evolution of 1 and 2. Be careful to choose the right adaptation gain (an adaptation gain of 0.01 would be appropriate).
In speech recognition only the right part of the structure is used. A characteristic sound is used as an input and the filter finds the coeffcients 1 2 n, so that the average output error squared is minimised; hence, the structure is trained in such a way, so that when its input is a delayed version of the sound, it will output the sound itself (and hence the term predictor); the predictor presented on the figure above would be a second order predictor. An th order predictor would be one that uses samples delayed by 1,2,...,n samples, to create its output.
In speech recognition only the right part of the structure is used. A characteristic sound is used as an input and the filter finds the coeffcients 1 2 n so that the average output error squared is minimised; hence, the structure is trained in such a way, so that when its input is a delayed version of the sound, it will output the sound itself (and hence the term predictor); the predictor presented on the figure above would be a second order predictor. An nth order predictor would be one that uses samples delayed by 1,2,...n samples, to create its output.
- Use the sound files that you have recorded to test the performance of such a predictor. You should have five files, each containing 1000 samples, corresponding to the sounds "e", "a", "s", "t" and "x". Use each file as an input vector to the predictor. Investigate the selection of the adaptation gain and the order of the predictor. You might also consider gear shifting.
The quality of the predictor is indicated by the prediction gain which is defined as 
- Access the performance of the predictor for each file by finding its prediction gain (typical values of prediction gains are on the order of 1-25).
- Optional: A much simplified version of the LMS algorithm is called the sign LMS algorithm and is based upon

Write a MATLAB routine to simulate this algorithm and compare its performance with that of the basic LMS algorithm. Alter the adapta-
tion gain as above and compare performances.
- Comment upon its convergence properties.