Testing The Difference Between Two Sample Means (Large Samples)
A large sample is defined as one which have 30 or more items as n≥30 whereas n is the sample size
In a business those occupied are constantly observant about the standards or specifications of the item which they sell for illustration, a trader may receive a batch of items at one time and another batch at a later time at the end he may have concluded that the two samples are different in certain specifications for illustration, mean weight mean lifespan, mean length and so on. Further it may become essential to establish whether the observed differences are statistically significant or not. If the differences are statistically significant then it means that such differences must be explained that is there are known reasons but if they are not statistically significant then it means that the difference observed have no known reasons and are mainly because of chance
If the differences are established to be statistically significant then it shows that the complaints, which necessitated that type of test, are justified
Assume X1 and X2 be any two samples whose sizes are n1 and n2 and mean x¯1 and x¯2. Standard deviation S1 and S2 respectively in order to test the difference between the two sample means, we apply the following formulas
Z = (x¯1 - x¯2)/S(x¯1 - x¯2)
Whereas S(x¯1 - x¯2) = 
Illustration 1
An agronomist was interested in the particular fertilizer yield output. He planted maize upon 50 equal pieces of land and the mean harvest acquired later was 60 bags per plot along with a standard deviation of 1.5 bags. The crops grew beneath natural circumstances and conditions with no the soil being treated with any type of fertilizer. The similar agronomist carried out an alternative experiment whereas he picked 60 plots in the similar area and planted the same plant of maize but a fertilizer was applied on these plots. After the harvest, it was established that the mean harvest was 63 bags per plot along with a standard deviation of 1.3 bags
Required
Conduct a statistical test in order to establish whether there was a significant difference among the mean harvests under the two kinds of field conditions. Employ 5 percent level of significance.
Solution
H0 : µ1 = µ2
H1 : µ1 ≠ µ2
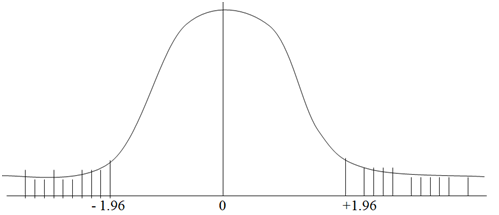
Critical values of the two tailed test at 5 percent level of significance are 1.96
The standardized value of the difference among sample means is described by Z whereas
Z = (x¯1 - x¯2)/S(x¯1 - x¯2)
Whereas S(x¯1 - x¯2) = √{(1.52/50) + (1.32/60)}
Z = ¦ {(60 - 63)/√ (0.045 + 0.028)} ¦
= 11.11