Reference no: EM131207950
1. The Simple Linear Model
The simple linear regression tries to better understand the functional dependence of one variable on another. In particular, consider a relationship of the form
Yi = α + β + εi
where Yi is a random variable and xi is another observable variable. The quantities α and β, the intercept and slope of the regression, are assumed to be fixed and unknown parameters, and εi is another random variable. It is also common to suppose that E[εi] = 0 (otherwise we could just rescale the excess into α), so that we have
E[Yi|xi] = α + βxi
This relationship is called the population regression function. One main purpose of regression is to predict Yi from knowledge of xi. We can also define the following sum of squares:
Sxx = i=1∑n (xi - x-)2
Syy = i=1∑n(yi - y-)2
Sxy = i=1∑n(xi - x-)(yi - y-)
RSS(a, b) = i=1∑n (yi - a - bxi)2
[1] Use the least squares approach to show that the estimators for α and β are:
α^ = y- - β^x-
β^ = Sxy/Sxx
[2] Let y^i = α^ + β^xi and u^i = yi - y^i. Show that:
i=1∑n u^i = 0
i=1∑nu^ix^i = 0
The conditional normal model is the one of the most common simple linear regression models. The observed data are pairs, (x1, Y1), . . . ,(xn, Yn). The values of the predictor variable, x1, . . . ,xn are considered to be known, fixed constants (you can think of them as being chosen and set by the experimenter). The random variables Y1, . . . , Yn are assumed to be independent. Furthermore,
Yi = α + βxi + εi
where ε1, . . . ,εn are i.i.d. N(0, σ2), which implies that the distribution of Yi is also normal:
Yi ~ N(α + βxi, σ2)
Thus, the population regression function is a linear function of x, that is, E(Y|x) = α + βx.
[3] Write down the likelihood function for the model, that is, the joint pdf of Y1, . . . ,Yn.
[4] Show that, for fixed values of σ2, maximizing the log likelihood function is equivalent of minimizing:
i=1∑n(Yi - α - βxi)2
And then the estimators are the same as in [2].
[5] Show that:
[Hint: find the expected value, variance and covariance of the estimators, and finally argue that they are normally distributed.]
[6] An unbiased estimator for σ2 is:
S2 = (1/n-2)i=1∑n(Yi - α^ - β^xi)2
Use the fact that S2 is independent of (α^, β^) and the following distributional result:
(n -2)S2/σ2 ~ χ2n-2
to find a 100(1 - α)% confidence interval for β. Also explain how you would test H0: β = β0 vs H1: β ≠ β0.
Now you will study prediction analysis. Assume that (x1, Y1), . . . ,(xn, Yn) satisfy the conditional normal regression model, and based on these n observations we have the estimates, α^, β^ and S2. Let x0 be a specified value of the predictor variable. First, consider estimating the mean of the Y population associated with x0, that is, E(Y|x0) = α + βx0. The obvious choice for a point estimator is α^ + β^x0.
[7] Show that:
α^ + β^x0 ~ N(α + βx0, σ2(1/n + ((x0 - x-)2/Sxx)))
[Hint: find the expected value and variance of the estimator, and finally argue that it is normally distributed.]
[8] Use that
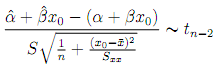
To find a 100(1- α)% confidence interval for the prediction.
Now you will asses the performance of the estimators in a simulation study using R. For all the questions below, use the following setup for i = 1, . . . ,n:
εi ~ N(0, 1)
xi ~ U(0, 2)
Yi = α + βxi + εi
α = β = 1
Also use set.seed(520) for easy comparison of the results.
[9] Generate 1,000 random samples of size n = 500 and, for each simulation, compute α^, β^ and S2. Plot the three densities and discuss the results.
[10] Let x0 = 1. Using the previous simulation study, compute also the distribution of the estimator for the predicted value α^ + β^x0. That is, for each simulation run, compute the point estimator and its variance from problem [7]. Finally, also compute the confidence interval from [8] and check if it has the right coverage.
2. The Generalized Linear Model
A generalized linear model (GLM) describes a relationship between the mean of a response variable Y and an independent variable x. But the relationship may be more complicated than the E[Yi] = α + βxi of the simple linear model from Section I. Many different models can be expressed as GLMs.
A GLM consists of three components: the random component, the systematic component, and the link function.
1. The response variables Y1, . . . ,Yn are the random component. They are assumed to be independent random variables, each with a distribution from a specified exponential family. The Yis are not identically distributed, but they each have a distribution from the same family: binomial, Poisson, normal, etc.
2. The systematic component is the model. It is the function of the predictor variable Xi, linear in the parameters, that is related to the mean of Yi. We will consider only α + βxi here.
3. Finally, the link function g(μ) links the two components by asserting that g(μi) = α + βxi, where μi = [Yi].
In probit regression, the link function is the standard normal cdf Φ (x) = P(Z ≤ x), where Z ~ N (0, 1). Thus, in this model we observe (Y1, x1), (Y2, x2), . . . ,(Yn, xn), where Yi ~ Bernoulli(πi) and πi = P(Yi = 1) = Φ(α + βxi).
[1] Derive the pdf Yi and compute E[Yi] and Var [Yi].
[2] Find the likelihood function of Y1, . . . ,Yn.
[3] Using the log-likelihood function, show that the first order condition for α and β are:
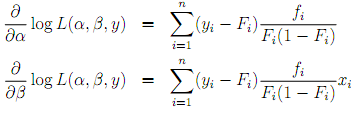
and find the exact expressions for Fi and fi.