Reference no: EM131086792
Section A: Population Growth
The populations of the world's two largest countries, China and India, are both growing rapidly.
Consider the official populations estimates for China and India in 2007 and 2012, below:
|
|
2007
|
2012 |
|
China
|
1 317
|
1 350 |
|
India
|
1 179
|
1 263 |
Population, millions.
The population growth rate, r, is a single number that describes this rate of growth. Below, we will derive a formula for this number, and then analyse the growth rates of both countries.
We usually think about population growth as following an exponential path:
Pt = P0ert
where: t represents time, usually measured in years,
Pt is the population in time t,
P0 is the starting population size, and
r is the population growth rate.
1. Sketch the exponential population growth formula on a graph, with time on the horizontal axis and population on the vertical axis. Mark P0 and interpret this point.
2. Re-arrange the formula above to give a formula for r.
3. Using this formula, compute the average annual population growth rate for both countries between 2007 and 2012.
4. Assuming these growth rates remain constant, estimate the 2020 populations of China and India. What are their projected populations for 2025? Write down a general formula for both countries' population in year t.
5. Using the formula you wrote down in question (4), in what year will the two countries' population be equal?
6. Assuming that both countries' average population growth rate doesn't change, how many years would it take for China's population to double in size? How many years would it take for India's population to double in size? What assumptions are you making in answering this question?
7. If a country's population follows an exponential curve indefinitely, is that population sustainable? Explain your answer in detail.
Section B: Malthusian Disaster
In 1793 the political economist Thomas Malthus noticed that that population growth in the United States had been doubling every 25 years (which is geometric growth), but that the level of food production had only increased by a fixed amount each year (which is arithmetic, or linear growth).
In An Essay on the Principle of Population, as It Affects the Future Improvement of Society, With Remarks on the Speculations of Mr Godwin, Mr Condorcet and Other Writers, he wrote:
[. . . ] the power of population is indefinitely greater than the power in the earth to produce subsistence for man. Population, when unchecked, increases in a geometrical ratio. Subsistence increases only in an arithmetical ratio. A slight acquaintance with numbers will shew the immensity of the first power in comparison of the second. By that law of our nature which makes food necessary to the life of man, the effects of these two unequal powers must be kept equal. This implies a strong and constantly operating check on population from the difficulty of subsistence. This difficulty must fall somewhere; and must necessarily be severely felt by a large portion of mankind.
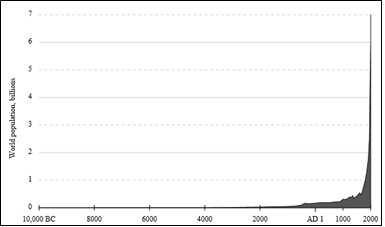
1. Look at the graph of world population growth above. Does the growth in the population look arithmetic (linear), or geometric?
2. Assume a population is initially a0 (when t=0) and that it grows by a ratio r every year. Write down an expression for the population in year t.
3. Malthus suggested that food supplies are growing at an arithmetic rate. Assume that the annual food supply is initially b tonnes per year, and that every year it increases by m tonnes. Write down an expression for the food supply, in tonnes, in year t.
4. Compare the expressions you found in questions (2) and (3). Let the initial population a0 be 1,000, let the population growth ratio r be 1.05, the initial annual food supply b be 1,800 tonnes, and the annual increase m be 140. On the same set of axes, where time is the horizontal axis and people/tonnes are the vertical axis, plot the values for t=0,10,20,30,40 and 50
5. Now, using the parameters in the previous question, suppose that each person consumes one tonne of food per year. During which year will the population begin to experience food shortages? Derive your answer mathematically, rather than graphically. You may assume there is no food stored from year to year.
6. Find the year that the population's demand for food exceeds 16,000 tonnes per year.
7. Suppose that the population growth rate is slightly lower, and that r=1.01. Now find the year that the population's demand for food exceeds 16,000 tonnes per year.
8. Practically speaking, is it inevitable that, if food is growing arithmetically (m>0) and population geometrically (r>1), that food supplies will always run out? In reality, does it look like earth is heading towards a Malthusian Disaster? Provide some evidence from your own research to support your answer.
Section C: Solar Panels Investment
Suppose a family consumes 15kWh of power per day. Concerned about its carbon footprint, the family would like to ensure 50% of its electricity comes from renewable sources. Rational and economically minded, the family would like to find the cheapest way to do so, and its planning horizon is the next 15 years. Assume the panels do not degrade over time, and at the end of 15 years, the solar panels will have zero residual value. Also assume that electricity provided by the solar panels has a per unit cost of zero (i.e. zero variable cost).
|
System Type
|
Electricity Generated / day
|
Installation Cost
|
|
1 kW system
|
3.9 kWh / day
|
$6 000
|
|
1.5 kW system
|
5.85 kWh
|
$7 000
|
|
2 kW system
|
7.8 kWh
|
$8 000
|
|
3 kW system
|
11.7 kWh
|
$11 000
|
|
4 kW system
|
15.6 kWh
|
$14 000
|
Typical solar systems available in Sydney.
To make this investment, the family would withdraw from its cash management trust, which is expected to return a steady 6.5% per year, compounded annually, for the foreseeable future. The remainder of the family's power is provided by the electrical grid. They face the following prices for energy they purchase:
|
Item
|
Units
|
Non-renewable
|
50% Renewable
|
100% Renewable
|
|
First 1000 kWh
|
$ per kWh
|
$0.2684
|
$0.2838
|
$0.2992
|
|
>1000 kWh
|
$ per kWh
|
$0.2805
|
$0.2959
|
$0.3113
|
|
Supply charge
|
$ per day
|
$0.6908
|
$0.6908
|
$0.6908
|
You may assume that electricity prices remain constant, and inflation can be ignored. Assume the power generated by the solar panels is the same year-round.
1. Which is the cheapest solar system type that would provide 50% of the family electricity consumption?
2. Assuming that the solar system performs as advertised, what is the family's quarterly bill from its energy provider? Assume there are 91 days in a quarter.
3. Using an annual discount rate of 6.5% and ignoring inflation, what is the present value of 15 years' worth of electricity bills?
4. Other than buying solar panels, what is the quarterly cost of the next best alternative, which still provides 50% renewable energy?
5. What is the present value of 30 years' worth of this solution? Again, ignore inflation, and use a discount rate of 6.5%.
6. Conditional on using at least 50% renewable energy, what is the net present value (NPV) of purchasing the solar panel system named in question (1)? Hint: to answer this question you will need to consider the present value of renewable energy sources and the present value residual electricity bills along with any associated installation costs.
7. Interpret your result from question (6). Is buying solar panels a good idea? Explain your answer.
8. Under the same assumptions as above, assume the family is not committed to purchasing renewable energy (i.e. the family is happy with consuming non-renewable energy from the grid.) What is the NPV of purchasing solar panels now?
9. Will the family in question (8) purchase the solar panel system named in question (1)?
10. Some governments have offered subsidies to consumers to install solar panels in their homes. Why?