Why are they the supply and demand curves

Assignment Help Macroeconomics
Reference no: EM131163819

Quantitative Literacy Assignment

Part I. Compute the values for the blank cells.

Henry Korn & Sons, Inc. - A Perfectly Competitive Firm

Q (Fields)

Price Per Ton

TR

MR Per Ton

FC

VC

TC

Profit or loss

AFC Per Ton

AVC Per Ton

ATC Per Ton

MC Per Ton

0

$40.00


$ 0


1000

$40.00


24,000

$59,000


2000

$40.00


40,000


3000

$40.00


60,000


4000

$40.00


85,000


5000

$40.00


$156,000


6000

$40.00


169,000


7000

$40.00


221,000


8000

$40.00


286,000


Part II. On the grid at the right - PLOT the per ton: P, MR, AVC, ATC, and M
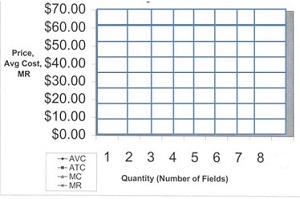
1307_Quantity Price Ratio.jpg

Part III. Individual Writing Questions. Answer the following questions in a few well-written sentences.

1) How many fields should Henry & Sons plant this spring to maximize profits, and what determines this?

2) Should they try to get a price higher than $40 per ton to improve profits? Why?

3) Assume the price is $40 per ton, should they consider closing down? Why, or why not?

4) Explain which of the variables computed in the table and plotted on the graph represent the supply and demand curves for the Henry Korn & Sons Company. Why are they the supply and demand curves?

Reference no: EM131163819

Questions Cloud

Conduct a swot analysis for your chosen facility : Conduct a SWOT analysis for your chosen facility that examines the forces that may affect the facility. Be sure to pay particular attention to the issues of financing, productivity, and marketing, as well as others you feel have the potential to impa..
Calculate the efficiencies of the restaurants : With the additional constraints, calculate the efficiencies of the restaurants. Comparing the original analysis, what patterns do you see?
Government spending or tax cut stimulates the economy : What is the mechanism by which an increase in government spending or a tax cut stimulates the economy? Government borrowing can “crowd out” private investment by…
Describe the criteria the us department of justice : Explain the criteria the U.S. Department of Justice and the Federal Trade Commission would follow when deciding on whether or not to approve a proposed merger.
Why are they the supply and demand curves : Explain which of the variables computed in the table and plotted on the graph represent the supply and demand curves for the Henry Korn & Sons Company. Why are they the supply and demand curves?
Average fixed cost equals total fixed cost divided : If marginal product is greater than average product, average product is falling. Marginal cost is less than average variable cost when average variable cost is falling. If the marginal cost curve is below the average variable cost curve, then margina..
Compute the horizontal force provided by the flange bolts : For water at 20°C, compute the horizontal force provided by the flange bolts to hold the nozzle fixed.
Find the largest key in a binary search tree : Write an algorith m that finds the largest key in a binary search tree. Analyze your algorithm, and show the results using order notation.
Identify the development level and style : Write a three to four page paper (not including the title and reference pages) about a contemporary leadership situation that is familiar to you. Your paper needs to: Identify the development level and style demonstrated in the situation

Reviews

Write a Review

Macroeconomics Questions & Answers

  Explain who would the main beneficiaries be

Explain who would the main beneficiaries be of tying Social Security

  What are some of the problems in using fixed weights

What are some of the problems in using fixed weights to compute real GDP and the GDP price index? How does the BEA’s approach attempt to solve these problems?

  What the bank would have to do to offset the output

Suppose the Bank of Canada wanted to keep the interest rateconstant. Show (using the money market diagram) what the Bank would have to do to offset the output fluctuations. What would this imply for the IS - LM model

  Production and profit decisions of firm

A firm uses a single plan with costs C = 160 + 16Q + .1Q 2  and faces the price equation P = 96 - .4Q. The firm's production manager claims that the firm's average cost of production is minimized at an output of 40 units.

  Computing onset of diminishing marginal product

The number of repairs manufactured by a computer repair shop depends on the number of employees as follows:

  Illustrate what components would be comprised in spreadsheet

Illustrate what components would be comprised in the spreadsheet. Explain how could you perform sensitivity analysis on the spread sheet.

  Estimate coefficients of a model in which accounting profit

A researcher has data on accounting profits, HHI, and different conditions of entry for different Canadian industries for the year 2009. Using this cross sectional data set, the researcher has estimated the coefficients of a model.

  Assume demand and supply conditions in the competitive

Assume demand and supply conditions in the competitive market for unskilled labor are as follows.

  Utilizing starbucks as the organization structure

Utilizing Starbucks as the organization, please help identify the market structure of the organization. Evaluate the effectiveness of this structure for the organization.

  Calculate the equilibrium level of income

In the aggregate expenditure model, suppose that consumption function is given by C=800+0.58(Y-TP), that planned investment (I) equals 250, and that government buy

  Suppose that in 1984 the total output in a single-good

suppose that in 1984 the total output in a single-good economy was 10000 buckets of chicken and the price of each

  Computation of arc elasticity of demand

Suppose that this price cut was completely responsible for its raise in revenues from 460 million yen in 1966 to 640 million yen in 1967. Compute the indicated arc elasticity of demand.

Free Assignment Quote

Assured A++ Grade

Get guaranteed satisfaction & time on delivery in every assignment order you paid with us! We ensure premium quality solution document along with free turntin report!

All rights reserved! Copyrights ©2019-2020 ExpertsMind IT Educational Pvt Ltd