Reference no: EM132249587 , Length: word count:1500
Homework -
Exercise 1 - Card and Krueger (1994) used the following natural experiment to study the elasticity of the demand for low-skilled workers with respect to the minimum wage: In 1992, the minimum wage in New Jersey rose from 4.25$ to 5.05$ per hour, but the minimum wage in neighboring Pennsylvania stayed constant. Card and Krueger collected data on employment at fast-food restaurants before and after the wage increase in the two states. They considered New Jersey workers as the treatment group and Pennsylvania workers as control group. They estimated then the following difference-in-difference (DD) model:
Yit = β0 + β1Dt + β2Ti + β3(Ti x Dt) + β4X1it + ... + βkXkit = uit
a) What are values of (Ti x Dt), Dt, Ti for:
a.1. A New Jersey restaurant in 1991?
a.2. A New Jersey restaurant in 1993?
a.3. A Pennsylvania restaurant in 1991?
a.4. A Pennsylvania restaurant in 1993?
b) In terms of the coefficients β0, β1, β2, β3, what is the expected number of employees in
b.1. A New Jersey restaurant in 1991?
b.2. A New Jersey restaurant in 1993?
b.3. A Pennsylvania restaurant in 1991?
b.4. A Pennsylvania restaurant in 1993?
c) In terms of the coefficients β0, β1, β2, β3, what is the average causal effect of the minimum wage on employment (the DD estimator of interest)?
d) What are the assumptions underlying the DD estimation in Card and Krueger?
e) Why did Card and Krueger use a DD estimator of the causal effect instead of the difference estimator "1993 New Jersey - 1993 Pennsylvania"?:
Yi,1993 = β0 + β2Ti,1993 + β4X1i,1993 + ... + βkXki,1993 + ui,1993,
subscript 1993 implying observations from 1993 only (t = 1993).
Exercise 2 - "job training.dta" contains the treated and control units from the male workers. Treated units are males having followed a job training program in 1976-1977.
a) Using 1978 observations, regress Ln(Income) on Treatment indicator controlling for individual characteristics. Assuming that the treatment assignment was not random but resulted from targeting workers with long unemployment histories, could you assign to the program effect the resulting income gap between earnings of treatment and control groups? Interpret the coefficient corresponding to the T variable.
b) Use difference-in-difference estimator to study the impact of the job training on the income of workers controlling for their individual characteristics. What is the effect of the program?
c) Explain what are assumptions underlying the DD estimation.
d) Explain why b) estimator is superior to the a) estimator.
e) What is the data structure (cross-sections / panel / time series)? What is a drawback of the data given their structure?
Exercise 3 - A researcher is considering to apply the regression discontinuity method (RDD) to estimate the impact of Medicare program implemented to decrease out-of-pocket health care expenses of the elderly. The eligibility for Medicare (Mi) is based on age:

According to the data, on the left of the threshold, 65, the probability of obtaining Medicare coverage is very small, although not strictly zero due to disability coverage. Probability of obtaining Medicare is increasing as age gets closer to 65. Then, there is a strong discontinuity past the age of 65. What type of RD design should the researcher use: fuzzy or shape? Explain. What are the main assumption(s) underlying the RDD application?
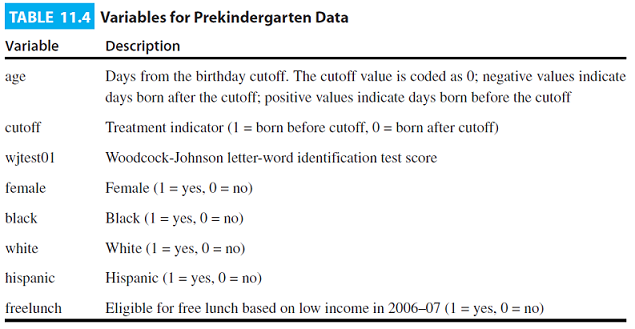
Exercise 4 - Use prekTulsa.dta
Context. "Universal prekindergarten" is a policy of providing high-quality, free school to 4-year olds. Its advocates argue that the pre-K will counteract socioeconomic disparities and boost productivity at long term. Following question below, use RD to evaluate the impact of the pre-K on test scores in Tulsa, Oklahoma. Note: children born on or before September 1, 2001, were eligible to enroll in the program in 2005-2006, while children born after this date had to wait until the next school year to enroll.
a) Why should there be a jump in the dependent variable right at the point where a child's birthday renders him or her eligible to have participated in preschool the previous year (2005-06) rather than the current year (2006-07)? Should we see jumps at other points as well?
b) Assess whether there is a discontinuity at the cutoff for the free-lunch status, gender, and race/ethnicity covariates. Is there necessary to check the distribution of the assignment variable?
c) Repeat the tests for covariate discontinuities, restricting the sample to a one-month (30-day) window on either side of the cutoff. Do the results change? Why or why not?
d) Use letter-word identification test score as the dependent variable to estimate a basic RD model controlling for treatment status (born before the cutoff) and the assignment variable (age measured as days from the cutoff). What is the estimated effect of the preschool program on letter-word identification test scores?
e) Estimate the effect of pre-K using an RD specification that allows the relationship to vary on either side of the cutoff. Do the results change? Should we prefer this model? Why or why not?
f) Add controls for lunch status, gender, and race/ethnicity to the model. Does adding these controls change the results? Why or why not?
g) Reestimate the model from part (f), limiting the window to one month (30 days) on either side of the cutoff. Do the results change? How do the standard errors in this model compare to those from the model using the full data set?
h) Reestimate the model from d) using the optimal bandwidth (hint: use rdob command running first the rdob.ado file).
What design should you use, sharp or fuzzy?
Report the estimated effect of the preschool program on letter-word identification test scores along with its standard error. What the optimal window found?
Note - Word count: 1500 and Software: STATA.
Attachment:- Assignment Files.rar