Reference no: EM132163790
FINAL PROJECT -
Babson International Bank (BIB) employs approximately 15,000 people spread in branches across North America (Canada, USA, Mexico). Recently, a class action suit was filed against BIB alleging gender bias. Specifically, this lawsuit claims that, on average, males receive higher salaries than females, simply because they are males. If true, this is illegal, and would be a significant legal as well as business problem for the Bank.
As part of BIB's investigation of this allegation, a random sample of 222 employees was selected and data collected for several variables for each employee:
- SALARY: Annual salary earned;
- AGE: Age in years;
- PRIOR: Years of industry experience prior to joining BIB;
- EDUC: Years of education;
- GRADE: Position classification (level) within BIB;
- EXPERI: Years of experience at BIB;
- GENDER: Gender;
- CITIZEN: Citizenship country; and
- LOCATION: Cost-of-living rating for employee's primary location.
The sample data is included in the Excel file BIB Sample Data.xlsx; the data is in one sheet and a description of the variables in a second sheet. (Note: while this salary data is fictional, it is reasonably consistent with current industry salary data.).
- It is recommended, but not required, that you use R for calculations. If you do, for uniformity please use the following code at the start of your analysis:
options(scipen = 10)
bib <- read_excel("~/QTM9515/BIB Sample Data.xlsx") # or similar
names(bib) <- tolower(names(bib))
bib$gender <- factor(bib$gender, levels = c("M", "F")) # base level = "M"
Ms. Marjorie N. Averr (known to her friends as "Marge") is the head of statistical analysis at BIB and has asked you to help investigate the gender bias allegation, using the sample data provided.
1. Ms. Averr asks you to first compile some summary statistics for the sample data:
a. Complete the table below for the variable SALARY. Show your output.
|
Sample Statistic
|
Numeric Value
|
|
Mean(SALARY)
|
|
|
Median(SALARY)
|
|
|
Minimum(SALARY)
|
|
|
Maximum(SALARY)
|
|
|
Range(SALARY)
|
|
|
Standard Deviation(SALARY)
|
|
|
Skew(SALARY) (choose)
|
Left-skewed or Right-skewed
|
b. What percent of the sample is female? Show output.
Percent female =
c. What are the average salaries for each gender? Show output.
SALARY: x ¯MALES = ________ x ¯FEMALES = ________
d. Is the difference in average salaries for statistically significant at the 5% level? Conduct a t-test and show your output, then interpret your conclusion in the context of the question (in addition to the statistical context). Show output.
Ms. Averr wants you to explore possible causes for the difference in salaries.
2. You expect that higher salaries would most likely be associated with greater education, experience, and responsibility.
a. Find the mean values for EDUC, EXPERI, PRIOR, and GRADE separately for each gender, and complete the table below (report values to 2 decimal places). Show output.
|
GENDER
|
EDUC
|
EXPERI
|
PRIOR
|
GRADE
|
|
M
|
|
|
|
|
|
F
|
|
|
|
|
b. While these results may be useful, you want to explore the relationships further, using graphics. Using Tableau, start by generating the chart below as closely as possible, but edit the colors to use yellow for females and red for males. Note: remember to uncheck "Aggregate Measures" in the Analysis menu. When you have made your chart, you can copy it with the command Worksheet > Copy > Image... and then paste it below.
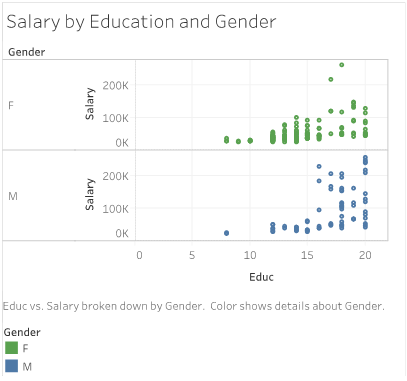
c. Continuing in this direction, add Average lines to each cell of your chart for both SALARY and EDUC (Average Line is in the Analytics tab in Tableau), and then add Trend Lines. You can hover on the Trend Line for Tableau to report the regression results for each gender. Report the slope coefficient and the R2 results, and paste your current chart below.
Regression for SALARY vs. EDUC:
|
Gender
|
Coefficient
|
R2
|
|
M
|
|
|
|
F
|
|
|
d. Interpret your results for the slope coefficients (the change in salary per year of education) above. Explain whether the values of the coefficients tend to support or refute the charge of gender bias.
3. Still using Tableau, you want to consider how salary depends on experience. However, you believe that total experience (prior to joining BIB in addition to years at the company) is most likely to be useful.
a. Construct a Calculated Field in Tableau named "Totl Exp" that is the sum of EXPERI and PRIOR (start by right-clicking on Experi in the Measures panel and Create > Calculated Field, entering the name at the top of the pop-up panel). Then produce a chart similar to the one in 2(c), this time for Salary vs. Total Experience by Gender. Again report the regression results and paste the chart in the document below.
Regression for SALARY vs. TOTL EXP:
|
Gender
|
Coefficient
|
R2
|
|
M
|
|
|
|
F
|
|
|
b. Interpret your results for the slope coefficients (the change in salary per year of experience) above. Explain whether the values of the coefficients tend to support or refute the charge of gender bias (4 points).
c. You decide to build a chart to show Ms. Averr these results for Salary vs. Education and vs. Total Experience, as well as vs. Grade, in a single chart similar to the one below (again using yellow and red colors by gender. Note: use the Columns "shelf" in Tableau to do this easily). Insert your chart below.
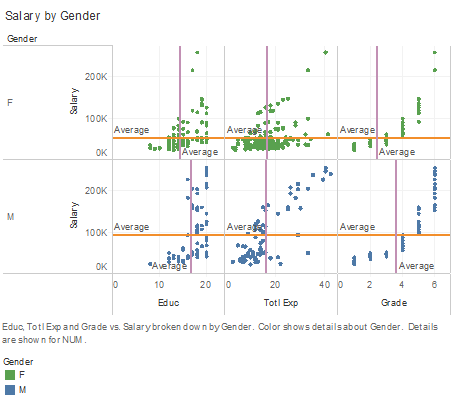
It appears that the case will both (1) go forward in the court, and (2) attract media attention. Ms. Averr has received a request from corporate counsel for analysis that can be used to support the argument that BIB does NOT practice gender bias in salaries. Your results so far may or may not be sufficient to support such an argument. You do notice in the last Tableau chart that the R2 for the SALARY vs. GRADE is larger than for the other 2 variables, indicating that further examination of salary vs. grade may be fruitful.
4. Write a brief on longer than a single page for BIB's legal staff that provides statistical support for the position that BIB does NOT practice gender bias. In addition to your work above, develop and present any other analyses that you believe relevant and that can support the argument. Make sure that your analysis and discussion is quantitative - qualitative arguments and personal views are not helpful. The best type of analyses to present are simple, and that present a quantitative explanation for the difference in overall average salary. Indicate also any potential weaknesses in your argument. Remember that your audience will be lawyers and legal staff members: intelligent individuals, but not statisticians.
You can and should add a single chart to your brief, if you believe that it provides a useful and effective summary of your results.
Please attach your brief at the end of this document.
Attachment:- Assignment Files.rar