Reference no: EM132158485
The head of global macrostrategies in your hedge fund group is considering taking a position depending on whether the Republicans will keep control of the Senate on Nov 6. She wants you to get a quick confirmation of the Nate Silver's projections.Google up Nate Silver if you have not heard of him yet. Your boss would be very surprised that you don't know who he is.In addition to Nate Silver's web site, also go on sites like 270towin and cookpolitical to get an idea of what a fully blown projection entails also have interesting forecasts.
You are going to simulate the distribution of the senate composition. The random variable to forecast is:
R = Number of Republican Senators in the 2019 Senate
Your main exhibit, a picture is worth a 1000 words MUST be two histogramsFigure 1 and Figure 2 looking like this..... with the right numbers of course! Note the mistake in the Figure: a blue 50 bar.
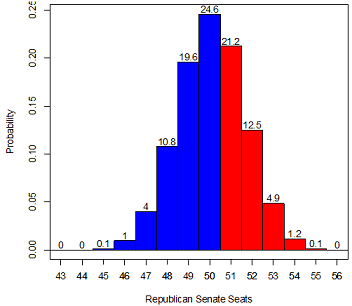
You know how picky the boss is about professional looking documents. The x-axis must have the range of the distribution, the y-axis must be a probability, since it is an integer distribution each bar must be exactly 1 (seat) wide and exactly centered on the unit, below 50 it must be blue, at 50 and above it must be red (this is because, at 50 the republican VP votes in the Senate). Finally, make sure to have the probability for each bar written on top like in the figure above. And any ridiculous amount of digits in a number is unprofessional and annoys the boss, use your professional common sense: 2 digits for p, 3 for σ.
Answer these questions in the order in your report:
a) The Basics
- How many seats does the Senate have?
- How many Republicans (R) seats are not up for reelection?
- How many Democrats (D) seats are not up for reelection?
- How many seats are up for reelection?
- As is well known, the 2 independent senators, Sanders (Vt) and King (Me) caucus with the
- Democratic party. So they cound as Democrats.
- What is the range for variable R (mininum, maximum), the number of Republicans senators after the Nov. 6th election.
b) The Basics refined
Your data manager, Pr. J. (aka the wizard) collected the most reliable and recent polls from likely voters, sometimes aggregating them for added power. He also identified the races where the incumbent (Democrat or Republican) is safe due to a large lid. See Senate.xlsx. All sources are from 270towin.com, realclearpolitics.com, project538, and ballotpedia. You decide to not simulate these races. However, make sure your data manager collected everything. A senate map in these sites will allow to quickly verify the races.
What voting behavior do you assume for undecided voters by rescaling p1 and p2?
You immediately notice that p1 and p2 do not sum to 1, because of 3rd candidates and undecided voters. To simplify, rescale the p1 and p2 so they sum to 2.
How many Republicans are "safe"?
How many Democrats are "safe"?
Give the revised domain for the variable R: [LB, UB]. (lower upper bounds)
Using the polls estimates (Call pR the average polled indicating a republican vote), what is the expected number of Republican Senators. Do the obvious: pR>0.5 indicates that the Republican is expected to win that race
c) Getting serious: estimating the uncertainty
You remember learning about the binomial distribution. To simulate races, you will assume the standard asymptotic distribution of p ^. You have all you need with the number polled for each race.
Be careful, Pr. J. was not consistent with the order of Republican and Democrate candidates in the .xlsx file. From now on, p ^, is the rescaled expected fraction of voters for the Republican candidate.
Prepare Table 1 (the only table).
Column 1: State, Column 2: p ^, Column 3: % undecided in original poll,
Column 4: Asymptotic standard deviation of p ^,
Column 5: the Margin of Error (MOE) of the poll: 1.96 x Column 4
Column 6: probability of Republican win in State using the asymptotic distribution.
Column 7: See below.
What is the average MOE for all the races. This is a self reported MOE of course, depending on the quality of the sample and the answers given. Nate Silver studied 15 years of polls and concluded that their actual MOE was 5%!
How many polls are reporting an MOE better than 5% ? Obviously, its corresponds to a standard error of 0.05/1.96 = 0.026.
In Column 7, write the worst of the self reported σPfor the State (Col. 4) and 0.026.
d) Ready to simulate
Figure 1 based on Column 4. Figure 2, based on Column 7, is a robustness check to a more sober view of the actual precision of these polls
You consider the races uncorrelated.
You do 100,000 draws of the distribution of the random variable R.
One "draw" of R is made by drawing from p ^ for each state. That is (about) 18 univariate random normals. Then a draw p > 0.5 means one simulated win for, sum the wins across the 18 draws and you have one draw of R.
Recall that you can input a vector of means and standard deviations in rnorm. If you simulate more than the length of the vector, rnorm cycles through the vector. This means you do the 100,000 times 18 draws in one line of code.Don't mix things up: be aware in what order rnorm outputs the draws, then how they get stored in a matrix for example. Computers generally stored information into arrays by column
Produce Figures 1 and 2.
In a couple sentences describe the impact of σp (Col. 4 or 7) on the distribution of R
In a couple sentences: how easonable is it to assume that the races have zero cross-correlation? What could be a common factor to all the races? Without doing it, what do you think your distribution would look like if you simulated positively correlated races?
Attachment:- Senate.zip