Reference no: EM13999161
Exercise 1:
Consider the following circuit:
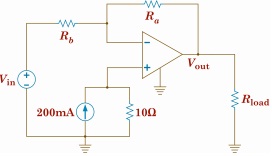
Assume first that Rb = 10kΩ, Rload = 300kΩ, and Vin = 1.5V.
(a) What value of Ra will result in Vout = 12V?
(b) What current is flowing out of the output pin of the op-amp?
(c) What is the power delivered by the op-amp? Is power balanced?
Assume now that the desired value of Vout is 27V. ( Rb and Vin remain the same.)
(d) How do your answers to parts (a), (b), and (c) change?
Assume finally that the original load is changed to Rload = 600kΩ. (Use Vout = 12V.)
(e) How do your answers to parts (a), (b), and (c) change?
To answer these questions, you are required to set up an Excel spreadsheet or worksheet. This is so that you can avoid repeating all of the calculations in parts (d) and (e) when the values of Vout and Rload change.
You should submit the worksheet in two modes: (1) with values, and (2) with formulas. To toggle between these two modes, use control-` (The ` is to the left of the "1".) In other words, create two PDF files, one for each mode.
For each, you should also print the row and column headings. To make this happen, go to "Page Setup...".
Each box in the worksheet is called a cell, which is identified by the column (A, B, C...) and row (1, 2, 3...). So, for instance, B3 refers to the contents or value of the cell located at the 3rd row of the 2nd column of your worksheet. On the next page, the value of B3 is 200.
Formulas are written in terms of cell identifiers. For instance, the formula =5*B3-4 will multiply the contents of B3 by 5 and then subtract 4. Like your calculator, parentheses are needed to override the hierarchy of operations. That is, 5x-4 is different from 5(x-4).
A colon is used to indicate a range of cell identifiers. For instance, B18:B20 refers to cells B18, B19, and B20.
The SUM command must be used for the power balance. For instance, =SUM(B18:B20) will compute the total power delivered by the three active elements in the circuit.
On the next page is an example of how you might set up your worksheet. (This same setup is available on Moodle as getStarted.xls.)
|
à
|
A
|
B
|
C
|
D
|
|
1
|
Rload (kohm)
|
300
|
300
|
600
|
|
2
|
Vout (V)
|
12
|
27
|
12
|
|
3
|
I0 (mA)
|
200
|
|
|
|
4
|
R (ohm)
|
10
|
|
|
|
5
|
Rb (kohm)
|
|
|
|
|
6
|
Vin (V)
|
|
|
|
|
7
|
Ra (kohm)
|
|
|
|
|
8
|
|
|
|
|
|
9
|
V+ (V)
|
|
|
|
|
10
|
V- (V)
|
=B9
|
|
|
|
11
|
|
|
|
|
|
12
|
Ib (mA)
|
|
|
|
|
13
|
Ia (mA)
|
|
|
|
|
14
|
Iload (mA)
|
|
|
|
|
15
|
Iopamp (mA)
|
|
|
|
|
16
|
|
|
|
|
|
17
|
Psupplied
|
|
|
|
|
18
|
I0 (mW)
|
|
|
|
|
19
|
Vin (mW)
|
|
|
|
|
20
|
op-amp (mW)
|
|
|
|
|
21
|
Pabsorbed
|
|
|
|
|
22
|
R (mW)
|
|
|
|
|
23
|
Ra (mW)
|
=B13^2*B7
|
|
|
|
24
|
Rb (mW)
|
|
|
|
|
25
|
Rload (mW)
|
|
|
|
|
26
|
|
|
|
|
|
27
|
powerBalance
|
|
|
|
Some of the input cells have been filled in, such as the possible values of Vout (12V and 27V) and Rload (300kΩ and 600kΩ), the value of the current source (in cell B3), and the value of the resistor in parallel with the current source (labeled R (ohm) here). Also shown are two calculated cells: the negative input voltage (always equal to the positive input voltage) and the power dissipated by resistor Ra (note the hierarchy of operations).
You need to supply the values and formulas for the remaining cells. You should complete column B first, and make sure all the formulas are correct before copying them.
There are many ways to copy formulas. Here is one of them. Select the contents of column B from row 3 to row 26 by clicking on cell B3 and then dragging down to B26 while still holding the mouse. You should see the cells become highlighted. When all of the desired cells are highlighted, release the mouse, then "copy" the contents, either by selecting "Copy" from the pull- down menu (Edit >> Copy) or with a keystroke (CTRL-C on a PC).
Pasting is very easy in Excel. Immediately after you have copied the desired cells, place the cursor in cell C3 and hit "Enter". (On a Mac, "Enter" is part of the numeric keypad, which is different from "Return".) All 24 cells are replaced appropriately. Note, for example, that the formula in cell C10 is now =C9. In other words, Excel uses relative indexing when copying formulas. Repeat the process to produce the formulas for column D.
Exercise 2:
Consider the following circuit:
(a) What value of k will result in V4 = 20V? (The result should be an integer.)
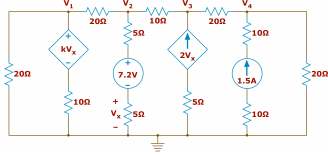
(b) To hold V4 to a tolerance of (20±0.1)V, what range of integers should k be held to?
(c) For the acceptable range of V4, what are the corresponding ranges of V1 , V2, and V3?
To answer these questions, you should set up another Excel worksheet. Nodal analysis at V4 yields an equation relating V3 and V4. Since there are three values of V4 to consider, it is inconvenient to use your calculator. Instead, you will use Excel to calculate the complete set of values by setting up columns appropriately. For each desired value of V4, Excel will compute the corresponding value of V3 . Then, nodal analysis at V3 yields an equation relating V2, V3, and V4. Since you know V3 and V4, you can now solve for V2, and so on, until you can calculate the desired value of k.
Once you have calculated V3, V2, V1, and k for V4 = 20V, copy the formulas into adjoining columns to calculate them for V4 = 20.1V and 19.9V. Next, change the values of V4 to 19.9 and in the new columns, and you will see all the other values change.
Note that the components of the circuit are not changing, so you do not need to have separate cells for each component (as you did for problem E1). Instead, derive your relationships and simplify them as much as possible before entering them into Excel as formulas. Your spreadsheet should be 4 columns by 6 rows, where the first column is used to label the rows, and the first five rows show the values of the four node voltages and two values of k, one exact and one rounded (for V4 = 19.9 and 20.1). Add a header row to label the columns.
Here is a new way to copy cells: Highlight all three columns (i.e., not the column of labels), with the desired formulas in the left-most column, then "fill right" using a pull-down menu (Edit >> Fill >> Right) or a keystroke (CTRL-R on both Macs and PCs).
Here is an even faster way to copy cells: Highlight the first column of values (for V4 = 20V), as before. Hover over the lower right corner of the bottom-most cell (do not click, just hover; if you click, you will see the highlighting disappear). While hovering, you should see the cursor change. (On a PC, it changes to a thin, black cross.) Now click and drag to the right, releasing the mouse only when you have highlighted the other two columns. Your formulas have been copied!
For part (b), you must use ROUNDUP(cellRef, 0) and ROUNDDOWN(cellRef, 0), where cellRef is a cell identifier, and the ‘0' will round to an integer. It is recommended to compute an exact value of k, then use an additional row of formulas to round up or down, depending on which is appropriate. (See the E2 worksheet in getStarted.xls.) It helps to think of this as a design problem, for which you must keep V4 within a specified range using only integer values of k.
Submit two pages as PDF, one with values and the other with formulas displayed. Also, make sure that the column and row headings are displayed. You should be able to fit the formulas onto one page wide. Go to File >> Page Setup... >> Page, and under "Scaling" choose "Fit to 1 page wide by 1 pages tall." Also, "Landscape" works well as the "Orientation".
Exercise 3:
Consider the following circuit, with vs(t) = 12u(-t) V and R = 2Ω.
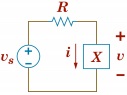
Assume for this problem that X is a capacitor with C = 25mF.
(a) What is the initial energy stored in the capacitor?
(b) Plot the voltage v across the capacitor from t = 0 until 10 time constants have passed.
(c) Plot the current i through the capacitor for the same time interval.
(d) Plot the power delivered by the capacitor for the same time interval.
(e) Show that the total energy delivered by the capacitor is approximately equal to the initial energy stored.
You must use Excel to answer these questions.
Submit two pages in PDF format, one with values displayed, and the other with formulas displayed, but only for the first page. Make sure the row and column headings are displayed as well. The formulas should fit onto one page wide. Go to File >> Page Setup... >> Page. Under "Orientation" choose Landscape, and under "Scaling" choose "Fit to 1 page wide by 20 pages wide". Also make sure every formula is completely visible.
Further, submit all three plots in PDF format on one page, but separate graphs. Don't forget axis labels, with units, for instance "Voltage (V)" and "time (ms)". The titles should be meaningful, for instance, "Voltage across discharging capacitor with C = 25mF and R = 2Ω", or "ECE 211 Exercise E3 Winter 2015".
Particularly inefficient code will be marked off. For instance, put the initial voltage into a cell then use it in your expression for v(t). Compute the initial current, then use it in your expression for i(t).
The following might help you.
Splitting the screen. Just above the vertical scroll bar is a small bubble. Click and drag down to create two windows, each with its own scroll bar. (You can also split the screen horizontally, but it is particularly useful here to do it vertically.)
Summing a column of values. For instance, to add the contents of cells A10 through A410, use as your formula = SUM(A10:A410). (You can also add along a row or within a block, but summing a column will be used to answer part (e).)
Suppressing automatic cell referencing. Whenever you copy a formula, cell references change automatically. Sometimes this is not desirable, so you can use $ to keep cell references fixed. For instance, when you copy =A10 to the right one column, it becomes =B10, and when you copy it down one row, it becomes =A11. However, a $ to the left of the row index keeps it the same, e.g., = A$10 stays the same when copied down. But the column index is free to change, e.g., =A$10 becomes =B$10 when copied to the right.
Similarly, a $ to the left of the column index keeps it the same, e.g., =$A10 stays the same when copied to the right, while now the row index is free to change, e.g., =$A10 becomes =$A11. Two $ symbols keeps both the row and column index the same, e.g., the formula =$A$10 remains the same when copied anywhere.
Set up your worksheet as shown below. The formula in A10, when copied down to cell A410, will create a column of 401 times, ranging from 0 to 10*[time constant]. (You will need to fill in the formula for A6.) To copy easily, place your cursor in cell A10, then shift-click in cell A410 of the lower screen. You should see A10-A410 become highlighted. Then use CTRL-D ("copy down") to copy the contents of A10 to the rest of the column. (You can also use a pull-down menu.) The formula for the voltage at time t is already given, though you need to enter the value for the initial voltage in B8. Fill in C8, C10, D8, and D10. Then copy the formulas in C10 and D10 as you did for B10. (If you want, there is a way to change B10 so that if you copy it to C10, the resulting formula will be correct!)
| <> |
A
|
B
|
C
|
D
|
|
1
|
R (ohm)
|
|
|
|
|
2
|
2
|
|
|
|
|
3
|
C (mF)
|
|
|
pct difference
|
|
4
|
25
|
|
|
|
|
5
|
tau (ms)
|
|
|
w delivered (J)
|
|
6
|
|
|
|
|
|
7
|
dt (ms)
|
v0 (V)
|
i0 (A)
|
w0 (J)
|
|
8
|
=A6/40
|
|
|
|
|
9
|
t (ms)
|
v (V)
|
i (A)
|
p (W)
|
|
10
|
=(row()-row(A$10))*A$8
|
=B$8*exp(-A10/A$6)
|
|
|
|
11
|
|
|
|
|
|
409
|
|
|
|
|
|
410
|
|
|
|
|
|
411
|
|
|
|
|
You should now have four columns with 401 values each. The next step is to make the plots for parts (b), (c), and (d). If needed, start by creating a new worksheet where you will put all three plots. Then select the original worksheet, click on A9, and then shift-click on B410. Two columns should be highlighted. Find the icon for "Chart Wizard" and click on it. As your Chart type, select "XY (Scatter)". As your sub-type, choose the icon showing lots of unconnected points, i.e., no trend lines. (Your points are close enough together that your scatter plots will look like curves.) Follow the directions in each step of the Chart Wizard. When you are asked where to put the plot, select a separate new worksheet. Move and resize as desired. (You should be able to fit all three plots on one sheet of paper, but they should not be on the same pair of axes.)
To create the next plot, copy the first and paste it just below the first. Click on the copy to select it. (You might need to click on white space to avoid editing the chart.) From the menu, choose Chart >> Source Data..., and click on the "Series" tab. The X Values can stay the same, since that is column of time data. For Name and Y Values, change column B references to column C. Repeat for the plot of power vs. time.
For part (e), recall that the energy delivered during an infinitesimal time interval is p(t) dt, and also recall that an integral is the sum over an infinite number of infinitesimal terms. We don't have this situation exactly, but it is close. Use the SUM formula in appropriate cells in column D to compute the total energy delivered by the capacitor (i.e., put the formula in D6), and compare it to the computed initial energy. Don't be overly concerned if you are off by 3% or so.
Exercise 4:
Consider the following circuit, with vs (t) = 12u(t) V and R = 2Ω.
Assume for this problem that X is an inductor with L = 50mH.
(a) What is the final energy stored in the inductor (after a long time)?
(b) Plot the current i through the inductor from t = 0 until 10 time constants have passed.
(c) Plot the voltage v across the inductor for the same time interval.
(d) Plot the power absorbed by the inductor for the same time interval.
(e) Show that the total energy absorbed by the inductor after a long time is approximately equal to the final energy stored.
Use Excel to answer these questions.
You can use the same structure as E3, but make sure to make appropriate changes, for instance, you will need the forced value of current to compute i(t). You also need the forced value of current to compute the total energy stored in the inductor after a long time.
Submit your worksheet on two pages in PDF format, one with values displayed, and the other with formulas displayed, but only for the first page. Make sure the row and column headings are displayed. Submit one page of graphs.
Particularly inefficient code will be marked off.
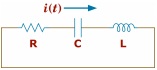
Exercise 5:
A resistor R, capacitor C, and inductor L are arranged as shown below. At time t = 0, the current i is 24A, and the capacitor voltage is zero.
Use C = 1/5 mF and L = 500mH. On one set of axes, graph the current i(t) from t = 0 to t = 200ms for R = 125Ω, 100Ω, and 28Ω.
Use Excel to answer this question.
Make sure that all three graphs are on the same chart. Don't forget axis labels, with units. You will also need a key to distinguish between the three graphs. The title should be meaningful. (The title should answer the questions, "What am I looking at?" and "What is different or special about this situation?")
Each graph should have at least 400 points in it. (401 works well, i.e., including t = 0.)
It is best if your worksheet has exactly four columns: column A is the time, and columns B through D are the three currents at each time. If you highlight all four columns of appropriate cells before you make the chart, Excel should automatically put all three on the same chart.
And if you choose your column headings well, Excel will use these to make a meaningful legend.
Above all of this time and current data, you should have space for R, L, C, i0, v0, α, ω0, "frequencies", di/dt|0+, and the two coefficients needed to write i(t). Note that α and di/dt|0+ depend on multiple factors, only one of which is changing (R). Therefore, the formulas should use dollar signs ($) to suppress the automatic cell referencing when you copy them.
Further, it is best to arrange the given information in column A above the list of time values. Also, since ω0 does not depend on resistance, it should also be computed in column A. Then, arrange the three resistance values across the next three columns, corresponding to the current values below them. Every other quantity depends on resistance, either directly or indirectly, so these are arranged vertically in the appropriate columns as well, ending with the computed coefficients needed to calculate i(t).
You will need to derive expressions for the coefficients, where the overdamped coefficients are particularly tricky to compute using a closed expression.
Submit one page of values and one page of formulas. Landscape view works well, and you might need to scale the page to fit all the columns onto one page. (We don't need to see all the rows!) You do not need to change the font size.
The graph should be on its own page. After you have created the graph, go to Chart >> Move chart... and click on "New sheet". Make sure you have a meaningful title, as well as axis labels with units, and a key.