Reference no: EM131442968
1. A small accounting firm pays each of its five clerks $35,000, two junior accountants $80,000 each, and the firm's owner $350,000. What is the mean salary paid at this firm? (Round your answer to the nearest whole number.)
How many of the employees earn less than the mean?
What is the median salary?
2. A small accounting firm pays each of its five clerks $35000, two junior accountants $90000 each, and the firm's owner $256000.
What is the mean salary paid at this firm?
How many of the employees earn less than the mean?
What is the median salary?
If this firm gives no raises to the clerks and junior accountants, but the owner now has a salary of $435000.
How does this change affect the mean?
How does it affect the median?
3. A study of diet and weight gain deliberately overfed 16 volunteers for eight weeks. The mean increase in fat was x = 2.63 kilograms and the standard deviation was s = 1.21 kilograms. What are x and s in pounds? (A kilogram is 2.2 pounds.)
4.Every few years, the National Assessment of Educational Progress asks a national sample of eighth-graders to perform the same math tasks. The goal is to get an honest picture of progress in math. Suppose these are the last few national mean scores, on a scale of 0 to 500.
|
Year
|
1990
|
1992
|
1996
|
2000
|
2003
|
2005
|
2008
|
|
Score
|
265
|
266
|
270
|
271
|
278
|
279
|
281
|
(a) Make a time plot of the mean scores, by hand. This is just a scatterplot of score against year. There is a slow linear increasing trend. (Do this on your own.)
(b) Find the regression line of mean score on time step-by-step. First calculate the mean and standard deviation of each variable and their correlation (use a calculator with these functions). Then find the equation of the least-squares line from these. (Round your answers to two decimal places.)
Draw the line on your scatterplot. What percent of the year-to-year variation in scores is explained by the linear trend? (Round your answer to one decimal place.)
(c) Now use software or the regression function on your calculator to verify your regression line. (Do this on your own.
5. A student wonders if tall women tend to date taller men than do short women. She measures herself, her dormitory roommate, and the women in the adjoining rooms; then she measures the next man each woman dates. The data (heights in inches) are listed below.
|
Women (x)
|
65
|
63
|
63
|
64
|
69
|
64
|
|
Men (y)
|
72
|
67
|
69
|
69
|
69
|
68
|
(a) Make a scatterplot of these data. (Do this on paper. Your instructor may ask you to turn this in.) Based on the scatterplot, do you expect the correlation to be positive or negative? Near ± 1 or not?
The correlation should be positive. It should be near 1.
The correlation should be negative. It should be near -1.
The correlation should be positive. It should not be near 1.
The correlation should be negative. It should not be near -1.
(b) Find the correlation r between the heights of the men and women. (Round your answer to three decimal places.)
(c) How would r change if all the men were 6 inches shorter than the heights given in the table? Does the correlation tell us whether women tend to date men taller than themselves?
r will not change. This correlation does imply that women tend to date men taller than themselves.
r will increase. This correlation does not imply that women tend to date men taller than themselves.
r will not change. This correlation does not imply that women tend to date men taller than themselves.
r will decrease. This correlation does imply that women tend to date men taller than themselves.
(d) If heights were measured in centimeters rather than inches, how would the correlation change? (There are 2.54 centimeters in an inch.)
r will be multiplied by 2.54.
r will not change.
r will increase by 2.54.
r will be divided by 2.54.
r will decrease by 2.54.
(e) If every woman dated a man exactly 3 inches taller than herself, what would be the correlation between male and female heights?
r will be equal to -1.
r will be equal to 1.
r will be the same as the value in (b).
r will be equal to 0.
6.
|
time
|
length
|
|
10
|
3.3
|
|
20
|
0.6
|
|
30
|
3.8
|
|
40
|
6.7
|
|
50
|
8.7
|
|
60
|
10.6
|
|
70
|
10.1
|
|
80
|
12.4
|
|
90
|
15.3
|
|
100
|
14.1
|
|
110
|
17.4
|
|
120
|
18.2
|
|
130
|
19.7
|
|
140
|
23.1
|
|
150
|
23.7
|
|
160
|
27.9
|
|
170
|
27.9
|
|
180
|
29.4
|
Find the mean and standard deviation of the times and icicle lengths for the provided DATA above. Find the correlation between the two variables. Use these five numbers to find the equation of the regression line for predicting length from time. Use the same five numbers to find the equation of the regression line for predicting the time an icicle has been growing from its length. (Round your answers to three decimal places.)
times x =
times s =
lengths x =
lengths s =
r =
time = + length
length = + time
7. Drilling down beneath a lake in Alaska yields chemical evidence of past changes in climate. Biological silicon, left by the skeletons of single-celled creatures called diatoms, measures the abundance of life in the lake. A rather complex variable based on the ratio of certain isotopes relative to ocean water gives an indirect measure of moisture, mostly from snow. As we drill down, we look farther into the past. Here are data from 2300 to 12,000 years ago:
|
Isotope
(%)
|
Silicon
(mg/g)
|
Isotope
(%)
|
Silicon
(mg/g)
|
Isotope
(%)
|
Silicon
(mg/g)
|
|
-19.90
|
95
|
-20.71
|
154
|
-21.63
|
222
|
|
-19.84
|
104
|
-20.80
|
265
|
-21.63
|
237
|
|
-19.46
|
114
|
-20.86
|
271
|
-21.19
|
186
|
|
-20.20
|
139
|
-21.28
|
294
|
-19.37
|
333
|
(a) Make a scatterplot of silicon (response) against isotope (explanatory).
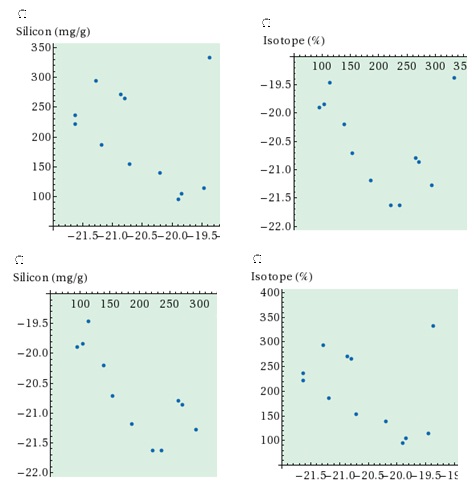
Ignoring the outlier, describe the direction, form, and strength of the relationship. The researchers say that this and relationships among other variables they measured are evidence for cyclic changes in climate that are linked to changes in the sun's activity.
weak positive association
moderate positive association
strong positive association
weak negative association
moderate negative association
strong negative association
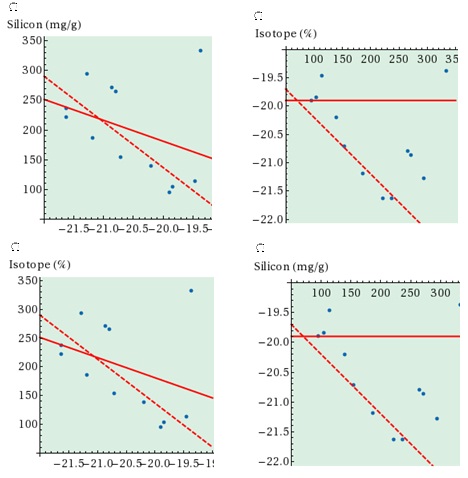
(b) Find the single outlier in the data. This point strongly influences the correlation. What is the correlation with this point? (Round your answer to two decimal places.)
What is the correlation without this point? (Round your answer to two decimal places.)
(c) Is the outlier also strongly influential for the regression line? Calculate the regression line with the outlier. (Round your slope to two decimal places, round your y-intercept to one decimal place.)
Calculate the regression line without the outlier. (Round your slope to two decimal places, round your y-intercept to one decimal place.)
Draw on your graph the two regression lines.
8. The table below gives data from a study that shows that social exclusion causes "real pain." That is, activity in the area of the brain that responds to physical pain goes up as distress from social exclusion goes up. The scatterplot for this data shows a moderately strong linear relationship. The data are given below.
|
Social
|
Brain
|
|
Social
|
Brain
|
|
Subject
|
distress
|
activity
|
Subject
|
distress
|
activity
|
|
1
|
1.22
|
-0.055
|
8
|
2.20
|
0.029
|
|
2
|
1.83
|
-0.040
|
9
|
2.58
|
0.031
|
|
3
|
1.08
|
-0.030
|
10
|
2.75
|
0.033
|
|
4
|
2.56
|
-0.015
|
11
|
2.75
|
0.064
|
|
5
|
2.17
|
-0.015
|
12
|
3.37
|
0.077
|
|
6
|
2.63
|
0.015
|
13
|
3.65
|
0.124
|
|
7
|
2.01
|
0.021
|
|
|
|
(a) What is the equation of the least-squares regression line for predicting brain activity from social distress score? (Round your answers to four decimal places.)
Make a scatterplot with this line drawn on it.
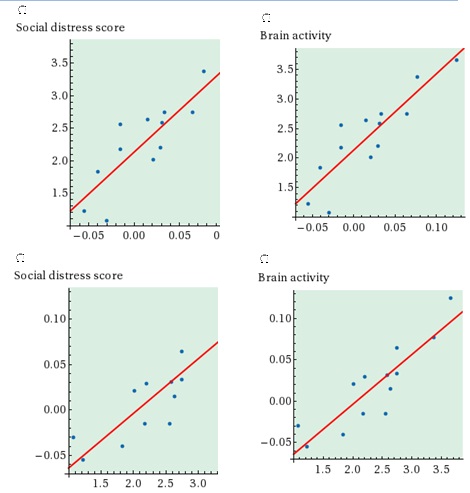
(b) On your plot, show the "up and over" lines that predict brain activity for social distress score 2.7. Use the equation of the regression line to get the predicted brain activity level. Verify that it agrees with your plot. (Round your answer to four decimal places.)
(c) What percent of the variation in brain activity among these subjects is explained by the straight-line relationship with social distress score? (Round your answer to a whole number.)