Reference no: EM132275557
MATLAB Assignment -
This MATLAB assignment is designed to reinforce your learning of the material. You should conduct the assigned matlab-based simulations, and submit a typed report in PDF that includes your observations, MATLAB codes, and generated figures. Solutions and answers to all questions, along with the figures, should be put together and organized into a concise report. The MATLAB codes are to be included at the end of the report in the Appendices section, with clear numbering.
Set 1: Generating Random Variables of Certain Distributions
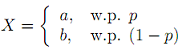
1. Let X be a random variable obeying Bernoulli distribution. In a general form, it takes on two possible values a and b with probabilities p and 1 - p respectively, with 0 ≤ p ≤ 1, as follows (w.p. stands for with probability):
(a) Let a = 1, b = 0, and p = 0.6. Use MATLAB to generate a sequence of N = 20 independent realizations of X. Write down these N numbers.
(b) Plot the histogram of these N numbers? What do you observe?
(c) Write a MATLAB function "function X=my-bernoulli(p, N, a, b)" that yields a sequence of N outcomes of the above Bernoulli random variable. You may use this function to conveniently simulate Bernoulli random variables in the future.
Hint: Suppose that Y is uniformly distributed between [0, 1], which can be generated using "rand". Let
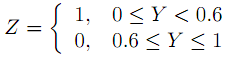
What is the probability PZ(Z = 1) =? What is the probability PZ(Z = 0) =?
Can you extend this idea to generate a Bernoulli distribution with any two possible values a and b, and any parameter p ∈ [0, 1]? The above RV Z is a special case of the RV X with a = 1, b = 0, p = 0.6.
Can you extend this idea to generate the outcomes of a discrete random variable with a finite set of values?
Set 2: Computing mean and variance via simulations
Let {xn}n=1N be N samples/realizations of a random variable X that obeys certain distribution. The sample mean X- and sample variance s2X are given by
X- = (X)N = 1/N n=1∑N xn;
s2X = 1/(N-1) n=1∑N(xn - X-)2.
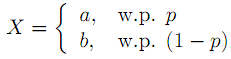
1. Let X be a random variable obeying Bernoulli distribution. It takes on two possible values a and b with probabilities p and 1 - p respectively, as follows (w.p. stands for with probability):
Let a = 1, b = 0, and p = 0.6.
(a) What are the analytical results for the mean mX and variance σ2X of X?
(b) Use MATLAB to generate a sequence of N = 20 independent realizations of X. Compute the sample mean X-and variance s2X using the formulae above. Compute the sample mean and variance using the MATLAB functions "mean" and "var". Do you get the same results?
(c) Repeat (b) for N = 100 and N = 1000. Do the sample mean and variance change? Are they closer to the analytical results? Document your observations concisely.
2. Let X be a uniform discrete random variable that takes on values {1, 2, . . . , K} with equal probability, that is, pX(X = k) = 1/K for any integer k ∈ {1, 2, . . . , K}. For example, a fair 6-sided dice corresponds to K = 6.
(a) What are the analytical results for the mean and variance of X?
(b) Use MATLAB to generate a sequence of N = 20 independent realizations xn of X. Compute the sample mean X- and variance s2X.
(c) Repeat (b) for N = 100 and N = 1000. Do the mean and variance change? Are they closer to the analytical results? Document your observations concisely.
(d) Another random variable Y is a uniformly distributed discrete random variable that takes on values {100, 101, 102, 103, 104, 105} with equal probability. Generate a set of N = 100 samples of Y, and compute its expected value mY and its sample mean Y-.
Set 3: Generating RVs of certain distributions as an inverse problem
The inverse problem:
Suppose that we would like to generate samples xi, i = 1, 2, . . . , following a desired distribution FX(x). This CDF FX(x) is a general function that is invertible, but not included in any MATLAB library. It can be proven that, if U is a uniformly distributed RV obeying U[0; 1] and X = g(U) = F-1X(U) (that is, U = FX(X)), then X is a RV with its CDF given by FX(x). Accordingly, you can start with generating a set of samples ui, ∀i, that are uniformly distributed between [0, 1], and then compute xi = g(ui) where the function g(·) is set to be g(u) = F-1X (u). The resulting xi, ∀i, obeys the CDF FX(x).
For a function of one random variable, solution to the inverse problem can be quite useful in system design, and in generating random numbers with arbitrary distributions for Monte Carlo simulations. This assignment provides such exercise.
1. The inverse problem above can be used to generate RVs of desired probabilistic distributions. We wish to generate a random number (RN) sequence xi, i = 1, . . . , N, with Rayleigh distribution. That is, {xi}i are random realizations of a RV X that obeys Rayleigh distribution. In this case, Rayleigh CDF : FX(x) = 1 - e-x^2/(2σ^2); inverse function : g(u) = F(-1)X (u) = √(-2σ2ln(1-u)).
When U is uniformly distributed in [0, 1], (1 - U) is uniform in [0, 1] as well. According to the inverse problem above, if we start with a RN sequence {ui}i=1N generated from a uniform distribution in [0, 1], then xi = √(-2 σ2lnui), i = 1, . . . , N, is a RN sequence with Rayleigh distribution.
(a) Find the mean and variance of the Rayleigh distributed X by analysis.
(b) Let σ2 = 1. Generate a RN sequence of length N = 1000 with Rayleigh distribution. Show the pdf by plotting the histogram. Compute the sample mean X- = 1/N i=1∑N xi and sample variance s2X = 1/(N-1) i=1∑N(xi - X-)2.
(c) Repeat (b) for σ2 = 0.5, 5, 10 respectively.
(d) Rayleigh distributed samples can also be generated from functions of Gaussian samples. Specifically, R is Rayleigh distributed with parameter σ2 if R = √(X2R + X2I) , where XR and XI are independent Gaussian RVs with the same distribution N(0, σ2). That is, for a complex variable X~ = XR + jXI, its amplitude R is Rayleigh distributed. Hence, you may use Gaussian samples XR and XI to generate Rayleigh distributed RV R. Repeat (b) using this alternative approach.
(e) Briefly explain your observations.
2. We wish to generate a RN sequence yi, i = 1, . . . , N, with exponential distribution, that is,
FY(y) = 1 - e-y/λ.
(a) Find the mean and variance of the exponential distributed Y by analysis.
(b) Generate a RN sequence of length N = 1000 with exponential distribution, for λ = 1. Show the pdf by plotting the histogram. Compute the sample mean and sample variance.
(c) Repeat (b) for λ = 0.5, 5 respectively.
(d) Briefly explain your observations.
Set 4: Law of Large Numbers
1. Let Xi, i = 1, . . . , N, be a sequence of independent identically distributed (i.i.d.) RVs, each following Rayleigh distribution with σ = 1. Consider a new RV given by the arithmetic mean
X = 1/N i=1∑NXi.
(a) Suppose that {Xi}i=1N are i.i.d. RVs with Rayleigh distribution (σ = 1) and N = 100. Generate L = 1000 realizations of X and show the pdf of X by plotting its histogram. Based on the histogram, do you think the pdf of X can be well approximated by a Gaussian pdf?
(b) Suppose that {Xi}i=1N are i.i.d. RVs with Rayleigh distribution (σ = 1) and N = 10000. Generate L = 1000 realizations of X and show the pdf of X by plotting its histogram. Do you think the pdf of X can be well approximated by a Gaussian pdf?
(c) Suppose that {Yi}i=1N are i.i.d. RVs with exponential distribution (λ = 1) and N = 100. Generate L = 1000 realizations of Y = 1/N i=1∑NYi and show the pdf of Y by plotting its histogram. Do you think the pdf of X can be well approximated by a Gaussian pdf?
(d) Suppose that {Yi}i=1N are i.i.d. RVs with exponential distribution (λ = 1) and N = 10000. Generate L = 1000 realizations of Y = 1/N i=1∑N Yi and show the pdf of Y by plotting its histogram. Do you think the pdf of X can be well approximated by a Gaussian pdf?
(e) Let
Z = (X1 + · · · + XN)/(Y1 + · · · + YN)
where {Xi} are i.i.d. Rayleigh distributed RVs and {Yi} are i.i.d. exponentially distributed RVs. N = 100. Generate L = 1000 random realizations of Z and compute the sample mean.
(f) Repeat (e) for N = 10000.
(g) Document your observations concisely.
Attachment:- Assignment File.rar