Summarizing raw data using graphs and charts

Assignment Help Advanced Statistics
Reference no: EM131552651

Purpose of Assignment

The purpose of this assignment is to provide students hands-on experience with summarizing raw data using graphs and charts and interpreting results.

Students will also use Excel Pivot Tables and Pivot Charts to summarize raw data. In the era of big data, tools like Pivot Tables and PowerPivot are critical tools to summarize the data.

Assignment Steps

Complete the five exercises on the Microsoft Excel file, "Graphical Techniques Template."

Note: Detailed instructions for the first four questions are provided in the document, "Graphical Techniques Instructions."Graphical Techniques Instructions

Question 1

Step 1: Select the entire table including the headings. Make sure you also select the headings (Projection TV, LCD TV, Plasm. TV).

Step 2: Click on the Insert tab on the top of Excel.

Step 3: Click on the column ch drop Own.

Step 4: Select 100% stacked collimn chart.

1029_figure.bmp

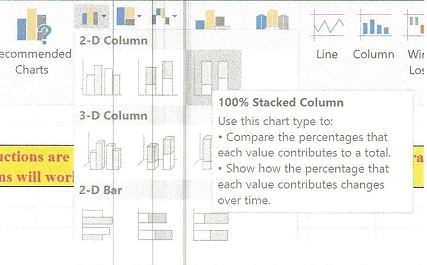
Step 5: Make sure you get the legend. If you don't get the legend, then please go back to Step 1 above and select the titles AND the data.

Step 6: Give a brief and sensible title to the chart.

Step 7: Optional - Label your Y-axis. Make sure you have ($ thousands) as units.

Question 2

Step 1: Select the entire table including the headings.

Step 2: Click on the Insert tab on the top of Excel.

Step 3: Click on the Pie Chart option

1595_figure1.jpg

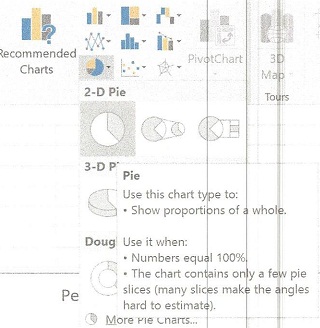
Step 4: Once the pie chart gets displayed, right-click on the pie chart and select "Add Data Labels".

Step 5: You will see the numbers on the pieces of the pie chart. Right-click these numbers and select "Format Data Labels".

160_figure2.jpg

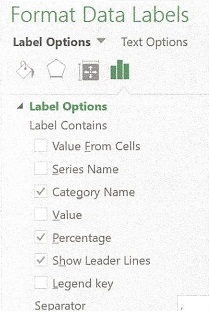
Step 6: Under "Format Data Labels", check mark only the Category Name, Percentage, and Show Leader Lines. Uncheck the Value box

Step 7: Close the "Format Data Labels' box.

Step 8: Delete the legend at the bottom of the pie chart.

Instructions for Question 3

Steps for creatin a Pivot Table

Step 1: Click on any one rating.

Step 2: Click on the Insert tab on the top of Excel.

Step 3: Click on PivotTable to the left.

Step 4: In the Create PivotTable window , click OK.

Step 5: In the PivotTable fields, drag the Restaurant Ratings to Rows.

Step 6: In the PivotTable fields, drag the Restaurant Ratings to Values.

Step 7: Close the Pivot fields box on the right.

Step 8: Right-click any number on the pivot table.

Step 9: Click on Sort.

Step 10: Click on From Largest to Smallest.

Step 11: Rename the columns.

Steps for creating a Pivot Bar Chart

Step 1: Click anywhere inside the pivot table

Step 2: On the right, click on Pivot Chart

Step 3: Click on Column or Bar on the Insert Chart window.

Step 4: Click OK to close the Insert Chart window.

Steps for creating a Pivot Pie Chart

Step 1: Click anywhere inside the pivot table

Step 2: On the right, click on PivotChart

Step 3: Click on Pie on the Insert Chart window

Step 4: Click OK to close the Insert Chart window.

Step 5: Right-click on the pie chart.

Step 6: Select Add Data Labels.

Step 7: Right-click on the numbers in the pieces of the pie.

Step 8: Select Format Data labels

Step 9: Check the Category and percentage boxes.

Step 10: Uncheck the Value box.

Instructions for Question 4

Step 1: Select the entire table Make sure you select the headings too.

Step 2: Click on the Insert tab on the Excel ribbon.

Step 3: Click on the line chart.

Step 4: The line chart should be plotted.

Verified Expert

This task provides a clear working example of level of significance. Statistical significance is found in a study, but the effect in reality is very small (i.e., there was a very minor difference in attitude between men and women). Were the results meaningful?An independent samples t test was conducted to determine whether differences exist between men and women on cultural competency scores

Reference no: EM131552651

Questions Cloud

Which one will have largest value of charge-to-mass ratio : Of all the possible singly charged ions that one can imagine forming from the periodic table of the elements, which one will have the largest value.
How to improve the efforts success probability : What recommendations would you make on how to improve the effort's success probability through use of Project Management Tools, Techniques, and/or Practices?
Common stock value long dash-variable growth : Newman manufacturing is considering a cash purchase of the stock of Grips Tool.
Find the charge-to-mass ratio of the oxygen ion : Modify this calculation to find the charge-to-mass ratio of the oxygen ion with charge -2e.
Summarizing raw data using graphs and charts : Provide students hands-on experience with summarizing raw data using graphs and charts and interpreting results.
Determine value of charge-to-mass ratio of the hydrogen ion : You know that one faraday of charge releases one mole of hydrogen atoms. From that fact determine the value of the charge-to-mass ratio of the hydrogen ion.
Based on internal rate of return analysis : DelRay Foods must purchase a new gumdrop machine. Based on an internal rate of return analysis, which machine should be recommended?
Identify a state health policy and the tools : Which would be the most appropriate researchable population for use in your research project?
What would be the fractional increase in the droplet mass : Suppose the charge on a 1-µm radius droplet increased by 3e because it picked up three nitrogen ions.

Reviews

inf1552651

8/3/2017 4:44:14 AM

Much obliged again for all your assistance. You've all genuinely been magnificent and have furnished me with the best papers I could have requested. I'll be reaching all of you again inside a week or somewhere in the vicinity. I simply need to sit tight for the assignments to really be doled out! Much obliged again to everything.

len1552651

7/4/2017 2:34:12 AM

This has to be completed in excel. Assignment Steps Microsoft Excel Complete the five exercises on the Microsoft Excel file, "Graphical Techniques Template." Note: Detailed instructions for the first four questions are provided in the document, "Graphical Techniques Instructions."

Write a Review

Advanced Statistics Questions & Answers

  Relationship between speed, flow and geometry

Write a project proposal on relationship between speed, flow and geometry on single carriageway roads.

  Logistic regression model

Compute the log-odds ratio for each group in Logistic regression model.

  Logistic regression

Foundations of Logistic Regression

  Probability and statistics

The tubes produced by a machine are defective. If six tubes are inspected at random , determine the probability that.

  Solve the linear model

o This is a linear model. If your model needs a different engine, then you need to rethink your approach to the model. Remember, there are no IF, Max, or MIN statements in linear models.

  Plan the analysis

Plan the analysis

  Quantitative analysis

State the hypotheses that you are going to test.

  Modelise as a markov chain

modelise as a markov chain

  Correlation and regression

What are the degrees of freedom for regression

  Construct a frequency distribution for payment method

Construct a frequency distribution for Payment method

  Perform simple linear regression

Perform simple linear regression

  Quality control analysis

Determining the root causes

Free Assignment Quote

Assured A++ Grade

Get guaranteed satisfaction & time on delivery in every assignment order you paid with us! We ensure premium quality solution document along with free turntin report!

All rights reserved! Copyrights ©2019-2020 ExpertsMind IT Educational Pvt Ltd