Simple production function

Assignment Help Macroeconomics
Reference no: EM13832708

Problem 1:

1. The following table shows for a simple production function.

Capital (K)

Labor (L)

Total Product (TP)

Average Product (AP)

Marginal Product (MP)

10

0

0

-

-

10

1

5


10

2

15


10

3

30


10

4

50


10

5

75


10

6

85


10

7

90


10

8

92


10

9

92


10

10

90


a. From the information in the table, calculate marginal and average products.

b. Graph the three functions (put total product on one graph and marginal and average products on another)

c. For what range of output does this function have diminishing marginal returns?

d. At what output is average product maximized?

2. Jim is considering quitting his job and using his saving to start a small business. He expects that his costs will consist of a lease on the building, inventory, and wages for two workers, electricity, and insurance.

a. Identify which costs are explicit and which are opportunity (Implicit) costs.

b. Identify which costs are fixed and which are variable.

3. The following table shows data for the simple production function used in question 1. Capital costs this firm $20 per unit, and labor costs $10 per worker.

K

L

TP

TFC

TVC

TC

AFC

AVC

ATC

MC

10

0


10

1


10

2


10

3


10

4


10

5


10

6


10

7


10

8


a. From the information in the table, calculate total fixed cost (TFC), average variable cost (TVC), total cost (TC), average fixed cost (AFC), average variable cost (AVC), average total cost (ATC),, and marginal cost (MC).

b. Graph your results, putting TFC, TVC, and TC on one graph and AFC, AVC, ATC, and MC on another.

c. At what point is average total cost minimized? At what point is average variable cost minimized?

Problem 3:Industry studies often  suggest that firm may have long run average cost curves that show some output range over which there are economies of scale and a wide range of output over which long-run average cost is constant; finally, at very high output, there are diseconomies of scale.

a. Draw a representative long-run average cost curve, and indicate the minimum efficient scale.

b. Would you expect that firms in an industry like this would all produce about the same level of output? Why?

Problem 3: The following graph shows economies of scale in the beer brewing industry.

2140_economies of scale in the beer brewing industry.jpg

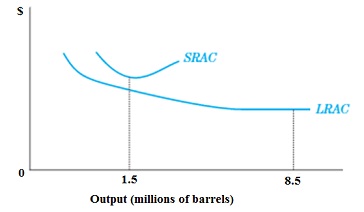
a. What does this graph tell us about the nature of economies of scale in the beer brewing industry?

b. What are the particular problems associated with the firm represented by the SATC curve shown in the graph? Does it represent a firm that would be able to survive over time?  

Reference no: EM13832708

Questions Cloud

An article in the wall street journal reported : An article in the Wall Street Journal reported that large hotel chains, such as Marriott, are tending to reduce the number of hotels that they franchise to outside owners and increase the number the chain owns and manages itself. What type of agency ..
Wage increase-what is the price elasticity of labor supply : Suppose a wage increase from $19 to $21 an hour increases the number of job applicants from 50 to 64. What is the price elasticity of labor supply?
Suppose the economy has a natural rate of unemployment : Suppose the economy has a natural rate of unemployment of 6%. Suppose short-run output over the next 4 years is +1%, 0%, -1%, and -2%. According to Okun’s law, what unemployment rates would expect to see in this economy?
Which side of that debate would think that they won : If the Founding Fathers could view the government of the United States today, which side of that debate would think that they won? Is government today exercising too much power over people or just enough power over people or not enough power over..
Simple production function : 1. The following table shows for a simple production function.
What is the break-even level of income : Assume that when an economy has a GDP of $500, Consumption is $550. The MPC is .75. Investment is 25. Begin the problem by setting up an Income/Consumption Schedule like the one on page 190 of your text. What is the Break-Even level of Income? What i..
Valid strategy option for entering in foreign market : Which of the following is/are not "valid" strategy options for entering and/or competing in foreign markets? A franchising strategy and a strategy of licensing foreign firms to use the company's technology or to produce and distribute the company's p..
A few of the main topics discussed in module : 1. A few of the main topics discussed in Module 1 are:  ICMP IP Fragmentation Traceroute
How does need for energy most contribute to environmental : How does the need for energy most contribute to environmental challenges

Reviews

Write a Review

Macroeconomics Questions & Answers

  Inflation targeting be a good policy

Why might it be difficult for the Fed to formally adopt inflation targeting?  Would inflation targeting be a good policy for the Fed in the present economic environment

  In using the taylor rule

In using the Taylor Rule as a guideline for monetary policy, what are the pros and cons of using forecasted values of inflation and output rather than observed values of these variables?

  Describe the present economic crisis situation in europe

Describe the present economic crisis situation in Europe.  Why has it been so difficult for the Europeans to find a solution to this problem?   Comment on what implications the crisis may have for the rest of the world if Europeans are not able to ag..

  Long-term federal government budget problems

Question:. Explain why there are long-term Federal government budget problems. Explain why the base-line forecast of the CBO is misleading.

  Derive and compare demand curve

Question based on Derive and compare demand curve,  Derive Ambrose's demand function for peanuts. How does it compare with Johnny's demand curve for peanuts?

  Problem based on utility function

Problem based on  Utility Function - Problem,  Answer and explain the following using a diagram which is completely labeled.

  Laffer curve : tax rate and tax revenue

Question based on Laffer Curve : Tax Rate and Tax Revenue,  Do raising tax rates necessarily raise tax revenue? What factors affect how tax revenue changes when tax rates change?

  Problem - income elasticity of demand

Problem - Income Elasticity of Demand,  Interpret the following Income Elasticities of Demand (YED) values for the following and state if the good is normal or inferior; YED= +0.5 and YED= -2.5

  Positive balance of payment

Question Positive Balance of Payment: "Things will look good for the US if we could just get to where we are consistently running a positive Balance of Payments."

  Effect of recession on the investment curve

Comment on the effect of a recession on the investment curve (only) and on the level of savings, investment, and the equilibrium real interest rate in the financial crisis that hits United States first starting in fall 2007.

  Affect of falling domestic investment on trade surplus and

How will a fall in domestic investment affect the trade surplus and net capital outflows in the domestic economy, the trade deficit and capital inflows in the rest of the world.

  Crises in the banking sector and bank run

Banking crises crisis decreases depositors' confidence in the banking system. What would be the effect of a rumor about a banking crisis on checkable deposits in such a country?

Free Assignment Quote

Assured A++ Grade

Get guaranteed satisfaction & time on delivery in every assignment order you paid with us! We ensure premium quality solution document along with free turntin report!

All rights reserved! Copyrights ©2019-2020 ExpertsMind IT Educational Pvt Ltd