Reference no: EM131021282
Phase 1 - Graphs of functions
Reading Task : Beecher, Penna, and Bittinger, pages 52-163. To launch your electronic book, please view the Course's Syllabus and click on the link for the text listed under Course Materials.
Task Type: Discussion Board Deliverable Length: 2-4 paragraphs plus graphs
You are the financial manager of a furniture company. It is your job to create supply and demand graphs that show the break-even point for the company. The functions that describe how the company can break even will be represented with linear equations. Linear inequalities will be used to graph conditions where the company experiences losses and also where the company would be making a profit.
Before you get started with the actual financial numbers, you will want to practice by creating and comparing various kinds of graphs. To start, you will be comparing the graphs of linear equations with those of linear inequalities.
Consider first a linear equation of the form y = mx + b.
1. Choose values of m and b, then plot the initial equation.
2. Change m to make a different plot.
3. Change b (but not m) in the original equation and plot the result.
4. Finally, use the new values of m and b to create a plot. Place all four on the same graph.
Now choose a linear inequality of the form y < mx + b or y > mx + b.
1. Choose values of m and b, then plot the initial equation.
2. Change m to make a different plot.
3. Change b (but not m) in the original equation, and plot the result.
4. Use the new values of m and b to create a plot.
5. Place all four on the same second graph.
Write a summary that compares the plots on the first graph to one another, then the plots on the second graph to one another, and finally the plots on the first graph to the plots on the second graph. Discuss the effects of changing m, b, and the equality or inequality sign.
Phase 2 - Linear equations
Task Type: Discussion Board Deliverable Length: 2-4 paragraphs plus a graph
Your company is considering various locations for expansion. It is your job to check out the various areas and the friendliness for business. One of the factors of interest is the average temperature.
As you start your drive, the first electronic sign you see states that the temperature is °C. You are not very familiar with this temperature scale. As you drive 10 miles east, the temperature is now listed as 69.8 °F. Is this warmer or colder? The next temperature, out another 10 miles, is 20.0 °C. It seems that temperature is declining with distance traveled to the east. However, you cannot tell, unless you are able to convert from one temperature scale to another.
To do so, you will need to solve a linear equation. The linear equation that relates °C to °F is as follows:
°F = 1.8 °C + 32.0
The following data was calculated in this way:
For the discussion, please do the following:
1.
a. Provide a plot of temperature versus distance east. Based on its appearance, is it a good linear model for predicting temperature as a function of distance?
b. Use the graph to determine the expected temperature at 50 miles east.
c. If the temperature is 65 °F, determine how many miles east you are.
d. Discuss several other questions that can be answered using the plot.
2. Solve the equation for °C.
3. What is 75 °F in Celsius?
4. What is 65 °F in Celsius?
Phase 3 - Polynomial and rational functions
Task Type: Discussion Board Deliverable Length: 2-4 paragraphs plus two graphs
Many different kinds of data can be modeled using polynomial functions.
An example of a polynomial function would be gas mileage for an automobile. If we compare gas mileage at two different speeds, V1 and V2, the gas required varies as (V1/V2), raised to the third power, (V1/V2)3.
Rational functions are also useful. For example, a cubic/cubic model can be used to explain the thermal expansion of metals with temperature. Rational functions have been used to describe problems as diverse as the movement of blood through the body to how to produce items at the lowest possible cost.
For this Discussion Board, create a set of data that can be modeled as a polynomial function. Please provide a reference to the data. Plot the data using Microsoft Excel including the equation for the fit. Discuss how closely the data seem to match to the best fit line. Do the same for data that can be modeled using a rational function.
Include in your answer how this can be used in a real-life application.
Phase 4 - Exponential and logarithmic functions
Reading Task : Beecher, Penna, and Bittinger, pages 330-410. To launch your electronic book, please view the Course's Syllabus and click on the link for the text listed under Course Materials.
Task Type: Discussion Board Deliverable Length: 2-4 paragraphs plus graphs
Many different kinds of data can be modeled using exponential and logarithmic functions. For example, exponential functions have been used by Thomas Malthus to describe the growth of human populations. Exponential growth has also been used to indicate how property values grow in strong real estate markets.
For this Discussion Board, create a set of data that can be modeled as y = exp(x); provide a reference to the data. Plot the data using Excel, including the equation for the fit. Do the same for data that can be modeled using y = log(x).
Task Type: Individual Project Deliverable Length: 1 page
Library assignment
Human populations can be modeled using an exponential growth function. Use the Library for research or other resources to find the following:
current world population current U.S. population
current growth rate of the world population current growth rate of the U.S. population
Starting in the current year, determine the following:
1. Based on current growth rates, how long will it take world population to reach exactly 7 billion? How long to reach exactly 10 billion?
2. Based on current growth rates, how long will it take for the U.S. population to reach exactly 400 million? How long for exactly 500 million?
Phase 5 - Matrices
Reading Task : Beecher, Penna, and Bittinger, pages 646-732. To launch your electronic book, please view the Course's Syllabus and click on the link for the text listed under Course Materials.
Task Type: Discussion Board Deliverable Length: 2-4 paragraphs plus graphs
Matrices are the most common and popular way to solve systems of equations. Provide an example of a matrix that can be solved using Gaussian elimination.
1. Show specifically how row operations can be used to solve the matrix.
2. State the solution.
3. Substitute the solution back into the equation to verify the solution.
Task Type: Individual Project Deliverable Length: 2-4 paragraphs plus graphs
Matrices have a number of interesting mathematical attributes, such as their dimensions, how they can be derived from linear systems, and the kinds of operations that can be performed on them.
Copy the questions to a Microsoft Word document and use an equation editor to enter the answers. Please answer the following questions about matrices.
1. Matrix methods can be used to solve linear programming problems. A linear programming problem is used to find an optimal solution, subject to stated restraints.
One typical application is to maximize profits. For example, a beauty parlor provides both highlighting and permanent wave services. It costs $5 in materials and requires 30 minutes to provide highlighting. However, it costs $12 in materials but requires 80 minutes to provide a perm. The store has at most $120 in materials and 800 minutes in labor per day to expend.
How many highlighting services and how many perms can the beauty parlor perform daily to maximize cost and time?
2. You are given the following system of linear equations:
3x - 2y + z = 2
-x + y = 3
-2y + 6z = -1
a. Provide a coefficient matrix corresponding to the system of linear equations.
b. What is the transpose of this matrix?
c. Find the determinant for this matrix.
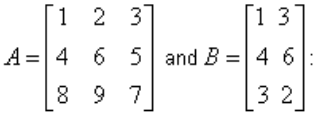
3. Calculate the following for
a. A * B
b. -3A
c. A-1
4. Solve the following linear system for x using Cramer's rule. Show work.
4x - y + z = -5
2x + 2y + 3z = 10
5x - 2y + 6z = 1