Reference no: EM13789999
Question 1. Consider the following data for a hypothetical economy that produces two goods, milk and honey.
|
Quantity Produced |
|
Prices |
|
|
Milk(litres) |
Honey(kg) |
Milk($/litre) |
Honey($/kg) |
| Year 1 |
100 |
40 |
2 |
6 |
| Year 2 |
120 |
25 |
3 |
6 |
a. Compute nominal GDP for each year in this economy.
b. Using year 1 as the base year, compute real GDP for each year. What is the percentage change in real GDP from year 1 to year 2?
c. Using year 1 as the base year, compute the GDP deflator for each year. What is the percentage change in the GDP deflator from year 1 to year 2?
Question 2. Consider the following table showing aggregate consumption expenditures and disposable income. All values are expressed in billions of constant dollars.
| Disposable Income (Ye) |
Desired Consumption (C) |
APC = C/YD |
MPC= ΔC/ΔYD |
| 0 |
150 |
|
|
| 100 |
225 |
|
|
| 200 |
300 |
|
|
| 300 |
375 |
|
|
| 400 |
450 |
|
|
| 500 |
525 |
|
|
| 600 |
600 |
|
|
| 700 |
675 |
|
|
| 800 |
750 |
|
|
a. Compute the average propensity to consume for each level of income and fill in the table.
b. Compute the marginal propensity to consume for each successive change in income and fill in the table.
c. Plot the consumption function on a scale diagram. What is its slope?
Question 3. Consider the following table showing national income and government net tax revenues in billions of dol¬lars. Assume that the level of government purchases is $155 billion.
| Actual Income(Y) |
Net Tax Revenues (T) |
Budget Balance(T-G) |
| 100 |
45 |
|
| 200 |
70 |
|
| 300 |
95 |
|
| 400 |
120 |
|
| 500 |
145 |
|
| 600 |
170 |
|
| 700 |
195 |
|
| 800 |
220 |
|
a. Compute the government's budget balance for each level of national income and fill in the table.
b. Suppose that net taxes are given by T, where T = to + t3 Y. Using the data in the table, deter¬mine the values of to and t1.
c. What is the interpretation of to?
d. What is the interpretation of ti?
e. Suppose the government decides to increase the level of its purchases of goods and services by $15 billion. What happens to the budget balance for any level of national income?
Question 4. Consider the following table showing national income and imports in billions of dollars. Assume that the level of exports is $300 billion.
a. Compute the level of net exports for each level of national income and fill in the table.
b. Plot the net export function on a scale diagram. Explain why it is downward sloping.
c. Suppose desired imports are given by IM = mo ml Y. Using the data in the table, determine the values of mo and mi.
d. What is the interpretation of mo?
e. What is the interpretation of ml?
f. Suppose that a major trading partner experiences a significant recession. Explain how this affects the net export function in your diagram.
| Actual Income(Y) |
Imports |
Net Exports (X- 1M) |
| 100 |
85 |
|
| 200 |
120 |
|
| 300 |
155 |
|
| 400 |
190 |
|
| 500 |
225 |
|
| 600 |
260 |
|
| 700 |
295 |
|
| 800 |
330 |
|
Question 5. The following diagram shows desired aggregate expenditure for the economy of Sunset Island. The AE curve assumes a net tax rate (t) of 10 percent, autonomous exports of $25 billion, and a marginal propensity to import (m) of 15 percent.
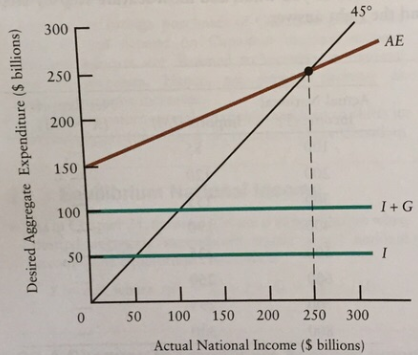
a. What is the level of desired investment expenditure (1)?
b. What is the level of government purchases (G)?
c. What is the autonomous portion of consumption?
d. What is total autonomous expenditure?
e. Starting from equilibrium national income of $250 billion, suppose government purchases decreased by $25 billion. Describe the effect on the AE curve and on equilibrium national income.
f. Starting from equilibrium national income of $250 billion, suppose the net tax rate increased from 10 percent to 30 percent of national income. Describe the effect on the AE curve and on equilibrium national income.
g. Starting from equilibrium national income of $250 bil-lion, suppose investment increased by $50 billion. Describe the effect on the AE curve and on equilibrium national income.
h. Starting from equilibrium national income of $250 billion, suppose the marginal propensity to import fell from IS percent to 5 percent of national
Question 6. The economy of Neverland has the following AD and AS schedules. Denote YAD as the level of real GDP along the AD curve; let YAS be the level of real GDP along the AS curve. GDP is shown in billions of 2002 dollars.
|
Price Level
|
YAD
|
YAS
|
|
90
|
1100
|
750
|
|
100
|
1000
|
825
|
|
110
|
900
|
900
|
|
120
|
800
|
975
|
|
130
|
700
|
1050
|
|
140
|
600
|
1125
|
a. Plot the AD and AS curves on a scale diagram.
b. What is the price level and level of real GDP in Neverland's macroeconomic equilibrium?
c. Suppose the level of potential output in Neverland is $950 billion. Is the current equilibrium level of real GDP greater than or less than potential? How does one refer to this particular output gap?
Question 7. The figure below shows the budget deficit function for a country.
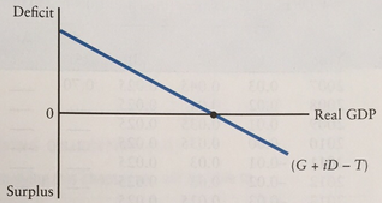
a. Explain why the budget deficit function is down-ward sloping.
b. If the government increases its level of purchases (G), what happens to the budget deficit at any level of real GDP? Show this in the diagram.
c. If the government increases the net tax rate, what happens to the deficit at any level of real GDP? Show this in the diagram.
d. Explain why a rise in the actual budget deficit does not necessarily reflect a change in fiscal policy.
e. How would a fiscal expansion appear in the diagram? A fiscal contraction?
Question 8. Fill in the blanks to make the following statements correct.
a. Money serves three functions___,__: and__
b. suppose children at a summer camp are each given a credit of $20 at the snack shop, where purchases are recorded but no cash is exchanged. This is an example of money as a(n)_____ and a(n)____.
c. paper money and coins that are not convertible into anything with intrinsic value, but are declared by the government to be legal tender, are known as_____.
d. The Bank of Canada has four main functions in the Canadian economy:
e. Canada has a(n) ____ reserve banking system, in which commercial banks keep only a fraction of their total deposits in reserves. A commercial bank has a(n)_____ratio that governs what it attempts to keep as reserves.
Question 9. The following diagram shows two economies, A and B. Each are in short-run equilibrium at point E, where the AD and AS curves intersect.
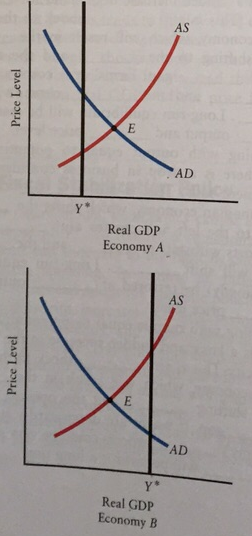
a. Explain why in Economy A wages and other factor prices will begin to rise, and why this will increase firms unit costs.
b. Following your answer in part (a), show the effect on the AS curve. Explain what happens to real GDP and the price level.
C. Explain why in Economy B wages and other factor prices will begin to fall, and why this will decrease firms unit costs.
d. Following your answer in part (c), show the effect on the AS curve. Explain what happens to real GDP and the price level.