Reference no: EM132416214
NEE2201 Linear Systems with MatLab Applications Assignment, College of Engineering and Science - Victoria University, Australia
Laboratory - Second Order Circuit Analysis Using MatLab
1. Objectives
In this laboratory exercise, you will be using MatLab to plot and observe some of the waveforms in a second order RLC parallel and series circuits. You will investigate the effect of resistances on the responses of these RLC second order circuits.
2. Preliminary
Please note that no students are allowed to enter the Laboratory before his/her preliminary is completed to the satisfaction of the laboratory instructor.
1. RLC parallel circuit
The inductance and capacitance in the parallel RLC circuit of Figure 1 are 12.5H and 2µF respectively and fixed. By using the method of Laplace transformation, find the step response of v(t) if I=2u(t) Amps (where u(t) is an unit step function) for the following three cases:
R = 8000?
R = 1250 ?
R = 500?

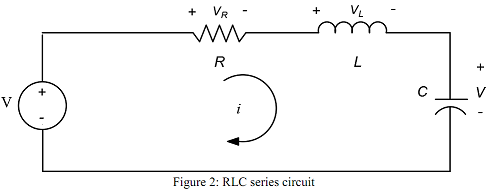
2. RLC series circuit
The inductance and capacitance in the series RLC circuit of Figure 2 are 12.5H and 2µF respectively and fixed. By using the method of Laplace transformation, find the step response of i(t) if V=2u(t) Volts (where u(t) is an unit step function for the following three cases:
R=8000?
R=5000 ?
R=500?
3. Using MatLab to Analyse Second Order Circuit
Instead of measuring circuit responses experimentally, it is possible to obtain circuit responses using a software simulation package. This laboratory investigates the effect of resistances on responses of a second-order circuit using MatLab.
(A) For I=2u(t) Amps in Figure 1, do the following:
1. Use MatLab commands to plot and label the voltage v(t) for the RLC parallel circuit with R=8000?. Note that the final time of the plot should be determined so as to display the steady-state of v(t).
2. Use MatLab commands to plot and label the voltage v(t) for the RLC parallel circuit with R=1250?. Note that the final time of the plot should be determined so as to display the steady-state of v(t).
3. Use MatLab commands to plot and label the voltage v(t) for the RLC parallel circuit with R=500?. Note that the final time of the plot should be determined so as to display the steady-state of v(t).
(B) For V=2u(t) Volts in Figure 2, do the following:
1. Use MatLab commands to plot and label the current i(t) for the RLC series circuit with R=8000?. Note that the final time of the plot should be determined so as to display the steady-state of i(t).
2. Use MatLab commands to plot and label the current i(t) for the RLC series circuit with R=5000?. Note that the final time of the plot should be determined so as to display the steady-state of i(t).
3. Use MatLab commands to plot and label the current i(t) for the RLC series circuit with R=500?. Note that the final time of the plot should be determined so as to display the steady-state of i(t).
4. Laboratory Report
A type-written report must be submitted to the drop box on VU Collaborate by each laboratory group of students (maximum of two students in a group) at the end of session 9. The report must include (but not limited to) the solutions of the preliminary work, the M-file that solve the problems in section 3 and all the labeled plots generated in section 3. In addition, you are required to compare the MatLab solutions with the analytic solutions in the completed preliminary work. You are also required to answer the following questions:
In a second order circuits such as RLC parallel and series circuits, less damping means the resulting output voltage v(t) or current i(t) will have more oscillations or vice versa.
For a parallel RLC circuit where L and C are held constant, will the damping on device's voltage v(t) be increased if the value of R is increased?
For a series RLC circuit where L and C are held constant, will the damping on loop current i(t) be increased if the value of R is increased?