Reference no: EM131224952
Acceleration on an Incline
Objectives
In this activity we will directly observe an example of motion with constant acceleration: a cart rolling up and down an incline. We will test a prediction for the magnitude of the acceleration of this motion.
Background
In previous experiments, you looked at the graphs of position, velocity and acceleration for motions that you controlled. Here you'll examine the motion of a cart on an incline, as an example of a system moving autonomously. You should find that the motion is well described as an example of motion with constant acceleration, and quantify the acceleration as a function of the steepness of the incline. You will test the hypothesis that the acceleration of the cart is given by the expression
a=g sin(θ)
where θ is the angle between the horizontal and the incline and g is the free fall acceleration.
To understand this result, we can reason this as follows: In free fall, the acceleration of an object is a vector of magnitude g pointing downwards. If we decompose this vector into components parallel and perpendicular to the incline, we obtain the component along the incline to be g sin(θ). As along the incline there is no other force or action, we predict this is to be its net acceleration.
To prepare for this lab you should review the properties of uniformly accelerated motion and review the derivation of the prediction for the acceleration magnitude sketched above.
Procedure
A. Interface Setup.
Check that interface is turned on, and that the stereo phone plugs of the Motion Sensor are connected to the Digital Inputs 1 and 2 on the interface. The yellow plug must be connected to Digital Channel 1 and the black plug to Digital Channel 2.
B. Software setup.
Open the Pasco Capstone program in the computer and click on the file folder icon, or use the File menu to open a new activity.
Find, in the main hard drive of the computer, the file "Activity_Motion_on_Incline.cap". If not available, download it from blackboard.
In Excel, create a table to organize your data. Create columns with the names of the relevant variables, such as θ, sin(θ), a, etc. Reserve a column to write the run number to which the measurements are associated.
C. Incline setup.
Set the motion sensor at the free end of the rail, and slide in and screw the angle indicator into the rail. Elevate the free end of the rail by setting it on top of a firm object, and secure the raised end so as to minimize motion during impact. Record the angle observed, determine the sine of the angle and input this value in your table. The motion sensor should be directed towards the cart. If you do not obtain good position measurements, you might adjust the alignment of the sensor.
D. Acceleration determination
Practice pushing the cart so that it runs up the incline but does not reach the motion sensor. On return of the cart to the bottom, you might want to manually stop it, so that collisions do not disrupt the setting.
Press the start button in the capstone interface and give a short push to the cart. Observe the position, velocity and acceleration graphs.
Do these graphs look like what you expect for a constant acceleration?
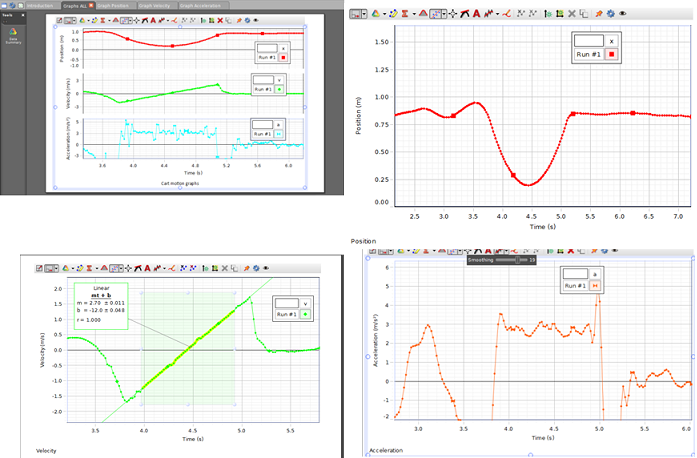
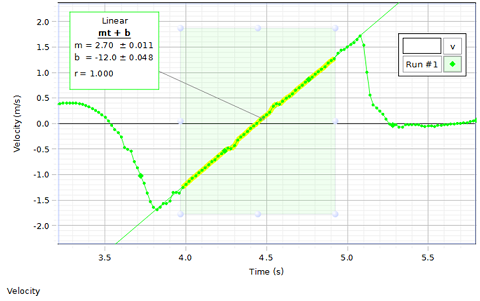
In the velocity graph, click-hold-drag to select the region of actual motion on the rail. The points of the graph in this region will be highlighted. Right click on the selected data, and select Fit. In the Fit menu, select linear. If the motion is indeed a uniform acceleration motion, the velocity graph is linear, and its slope is the acceleration. Record the acceleration obtained into the table. Check this value with the values displayed in the acceleration graph.
D. Comparison with theory
Repeat the above procedure for different angles. You should obtain a table with at least 6 different angles, and the corresponding accelerations. For each angle you should carry out a minimum of two runs. Create a plot of the acceleration vs. the sine of the angle in your Excel spreadsheet. Fit this data to a line, determine the slope and compare the slope value with a theoretical prediction for the slope.
E. Variations
You can repeat the above procedure using a cart with an added mass. First, review the prediction described at the beginning of this procedure and identify its implications for this new setting. Carry out measurements of the acceleration as above.
E. Short report.
1. Are the graphs of position, velocity and acceleration what you expected? Describe in words the features that help you make these identifications.
2. According to the theoretical formula, what should be the slope of the acceleration versus angle sine graph? What value did you obtain?
3. Analyze the cases, both from physical and mathematical points of view, in which the incline is horizontal and fully vertical.
4. Identify the sources of error in this experiment.