Reference no: EM131634290
Answer the following questions:
1. When are bar charts most commonly used?
2. Let's say you wanted to create a table showing how many people in each department preferred salad, pizza, or sandwiches for lunch. What would you use as column headings?
3. You are researching ways to boost employee morale for a proposal. How can you avoid copyright issues when you find materials from outside sources?
4. You want to add a picture of a potential new office layout to the title page of a proposal. How can you adjust the size of the image without changing its proportions?
5. If you wanted to show how many employees at your office ride a bicycle to work in comparison to the number of employees who drive a car, take public transportation, or walk, what visual would be best?
Analyze - Analyze the various graphs for a progress report, using the following scenario:
You are putting together a progress report for a six-month project to update the company website. The project has been in progress for the past three months. The project has a total budget of $5,500 for the entire six months, which has been broken down into amounts to be spent each month. You are putting together a progress report for the project and need a visual to show how the actual amount spent to date compares to the budgeted amount.
1. Here is a table showing the breakdown of how much of the total budget should be spent by the end of each month, along with the actual spending.
|
Month
|
Budget per Month
|
Cumulative Budgeted Spending
|
Actual Spending to Date
|
|
January
|
$2,000
|
$2,000
|
$2,000
|
|
February
|
$1,000
|
$3,000
|
$3,500
|
|
March
|
$500
|
$3,500
|
$5,000
|
|
April
|
$500
|
$4,000
|
-
|
|
May
|
$1,000
|
$5,000
|
-
|
|
June
|
$500
|
$5,500
|
-
|
a) How much of the total budget does the company have left to spend after the first three months?
b) How does the actual amount left to spend differ from the budgeted amount for the remaining three months of the project?
2. Look at the bar chart below, and answer the following questions:
a. Is the company over, under, or on budget for February? How do you know?
b. Compare the actuals spent versus budgeted amount in January to the actuals spent versus budgeted amount in March?
3. Look at the line graph below, and answer the following question:
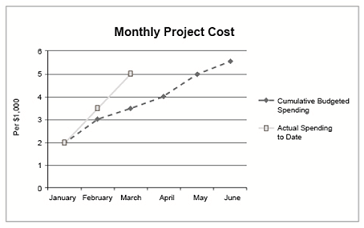
a. Notice the trend of the Actual Spend line. If this trend continues through June, will the project remain on budget? If not, what will need to happen to the trend to keep the project on budget?
4. Look at the pie chart below, and answer the following questions:
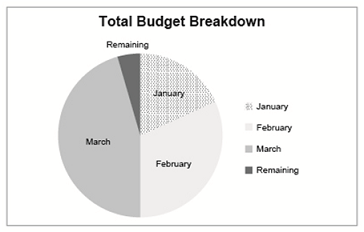
a. In which month was the majority of the budget spent?
b. Does the company have more or less money to spend in the remaining three months of the project than it spent in the first three months?
Synthesize - Determine and design the best visuals for a progress report, including appropriate graphs, tables, illustrations, text boxes, and other visuals. You will need to think about how the visuals relate to the information presented in the progress report and how the visuals will aid readers' understanding.
1. Using the graphs above, which would you choose to include in the Costs section of your progress report to show how project spending compares to the budget so far? Explain why.
2. Using the graphs above, which would you chose to include in the Costs section of your progress report to show how much of the total budget remains for the project? Explain why.
3. Examine the table in the section above.
a. Recreate the exact table shown above in a separate document. Submit this document to your teacher with your worksheet.
b. Explain how you created the table.
4. In your progress report, you want the Work Completed section to follow your Summary of Costs. To date, the company has rewritten the home page content, created a new logo, and updated the overall structure of the site. Currently, an idea for site navigation has been proposed but not yet confirmed. You want to include a visual of the navigation option in the progress report.
a. The navigation option includes these links from the Home Page: About, Services, Customer Reviews, and Contact. The About section would include links to History and Our Mission; the Services section would also include links to Pricing, Scope, and Timeline. Show an example of a simple, custom graphic to display the navigation.
b. Explain how you created your graphic.
5. Once you finish your progress report, your manager wants to look it over before distributing it to everyone in the company. What is the best way to give this report to your manager and why?
6. Your manager looks over the report and decides that because you did such a thorough job with the report, your next project will be to help update the company's business cards. Create a sample business card that includes a graphic to represent the law firm, Stevens & Patterson.
Just 1 or 2 words or sentences for each answer.