Reference no: EM131090171
1. Given f(x)= |x|, graph g(x) = |x| + 2 and h(x) |x| - 2 on the same grid.
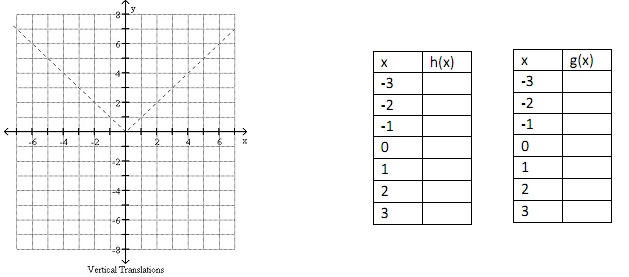
The graph of f(x) = |x| + c is translated _____ units _____ for c> 0.
The graph of f(x) = |x| - c is translated _____ units _____ for c> 0.
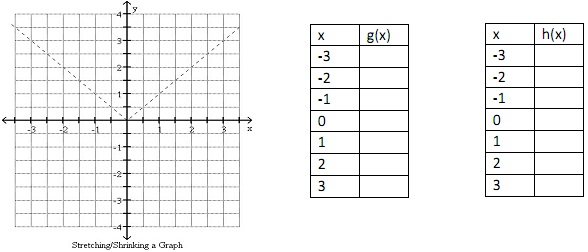
2. Given f(x)= |x|, graph g(x) = |x + 2| and h(x) |x - 2| on the same grid.

The graph of f(x) = |x + c| is translated _____ units _____ for c> 0.
The graph of f(x) = |x - c| is translated _____ units _____ for c> 0.
3. Given f (x)= |x|, graph g(x) = 2|x| and h(x) = 1/2 |x| on the same grid.
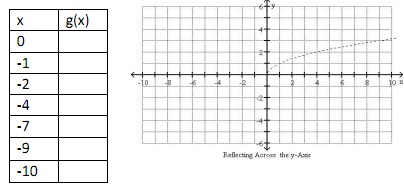
4. Given f (x)= √x, graph g(x) = -√x on the same grid.
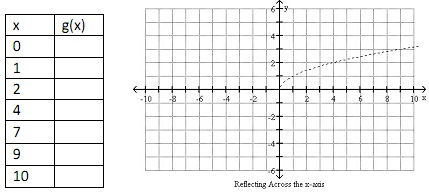
5. Given f (x) = √x, graph g(x) = √-x on the same grid.
|
Summarise the statistical evidence
: Stating the assumptions on which your arguments and conclusions are based, summarise the statistical evidence regarding the effectiveness of this diet.
|
|
A communication skill or an interpersonal relationship
: Choose a communication skill or an interpersonal relationship that you want to improve. Describe how and why the skill or relationship needs improving. Give examples of when you utilize the skill and when you don't.
|
|
Underlying population and testing procedure
: Suppose that n = 9, ¯X = 85 and the sample standard deviation is s = 2. Test H0: μ = 83 against H1 : μ ≠ 83, stating any assumptions made about the underlying population, and the testing procedure.
|
|
Calculate the corresponding p-value
: Evaluate a test statistic for the null hypothesis H0: μ = 30 against the two-sided alternative hypothesis H1: μ _= 30, and by plotting this on its reference distribution, identify and calculate the corresponding p-value associated with H0. What ar..
|
|
Given function and graph on the same grid
: Given f(x)= |x|, graph g(x) = |x| + 2 and h(x) |x| - 2 on the same grid and given f(x)= |x|, graph g(x) = |x + 2| and h(x) |x - 2| on the same grid.
|
|
Use any website summary sources
: 2) Write only about one of the problems in standardized testing, now we have too many stuff in the essay we need to focus. for example, only write about how the standardized testing is not making students to improve, and give up all the other poin..
|
|
Point estimate for the average customers
: A sample of 50 days showed that a fast food restaurant served an average of 182 customers during lunchtime (11:00 A.M. to 2:00 P.M). The standard deviation of the population is 8. Find the 96.24% confidence interval. A) What is the point estimate ..
|
|
Determine the accuracy of the temperature measurement
: Perform experiments to determine the accuracy of the temperature measurement. Interface three LEDs to TH TL TCOM outputs, and perform experiments to verify the temperature controller in the DS1620 is operating properly
|
|
Average hemoglobin reading for teachers
: The average hemoglobin reading for a sample of 20 teachers was 16 grams per 100 milliliters, with a sample standard deviation of 2 grams. Hemoglobin readings follow a normal distribution. Find the 99% confidence interval of the true mean. A) What ..
|