Find the sample correlation coefficient between x and y

Assignment Help Econometrics
Reference no: EM131169078

A CONCLUDING EXAMPLE: RELATIONSHIP BETWEEN WAGES AND PRODUCTIVITY IN THE U.S. BUSINESS SECTOR, 1959-2006

According to the marginal productivity theory of microeconomics, we would expect a positive relationship between wages and worker productivity. To see if this so, in Table we provide data on labor productivity, as measured by the index of output per hour of all persons, and wages, as measured by the index of real compensation per hour, for the business sector of the U.S. economy for the period 1959 to 2006. The base year of the index is 1992 and hourly real compensation is hourly compensation divided by the consumer price index (CPI).

Let Compensation (Y) = index of real compensation and Productivity (X) = index of output per hour of all persons. Plotting these data, we obtain the scatter diagram shown in Figure.

735_Figure.png

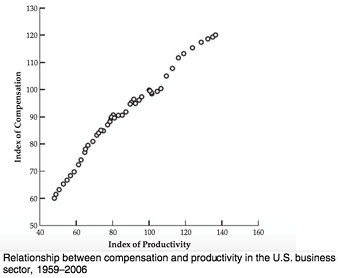
This figure shows a very close linear relationship between labor productivity and real wages. Therefore, we can use a (bivariate) linear regression to model the data given in Table. Using EViews, we obtain the following results:

Dependent Variable: Compensation Method: Least Squares Sample: 1959 2006

Included observations: 48


Coefficient

Std. Error

t-Statistic

Prob.

C

33.63603

1.400085

24.02428

0.0000

Productivity

0.661444

0.015640

42.29178

0.0000

R-squared

0.974926


Adjusted R-squared

0.974381


S.E. of regression

2.571761


Sum squared resid

304.2420


Durbin-Watson stat

0.146315


Let us interpret the results. The slope coefficient of about 0.66 suggests that if the index of productivity goes up by a unit, the index of real wages will go up, on average, by 0.66 units. This coefficient is highly significant, for the t value of about 42.3 (obtained under the assumption that the true population coefficient is zero) is highly significant for the p value is almost zero. The intercept coefficient, C, is also highly significant, for the p value of obtaining a t value for this coefficient of as much as about 24 is practically zero.

The R2 value of about 0.97 means that the index of productivity explains about 97 percent of the variation in the index of real compensation. This is a very high value, since an R2 can at most be 1.

1. Find the sample correlation coefficient between X and Y.

2. How would you decide if a simple linear regression model is appropriate for the relationship between X and Y?

3. If a simple linear regression model is indeed appropriate for the relationship, find the estimated regression line.  And interpret this line.

4. Find the predicted compensation with the productivity of 100.  What is the residual for the observation of the base year, 1992?

5. Is there strong evidence that the compensation is linearly related to productivity? Justify your answer.

6. Find a 95% confidence interval for the slope parameter B2

7. Is there strong evidence that B2 is greater than 0.65?  Justify your answer using the level of significance α = 0.05.

8. Find an estimate for the variance of the error in the simple linear regression model.

9. Find the 90% confidence interval for the mean compensation when the productivity is 85 and interpret the C.I.

10. Find the 90% confidence interval for the compensation of a year when the productivity is 85 and interpret the C.I.

11. Check the normality assumption.

Reference no: EM131169078

Questions Cloud

Design the continuous beam along column line two : A floor system is to consist of beams, girders, and a slab; a partial floor plan is shown. Design the continuous one-way slab. Design the continuous beam along column line 2.
How earnings growth explains growth in stock price : Make a graph showing how earnings growth explains growth in stock price. Does it appear to be true that (on the average in the long run) stock price growth parallels earnings growth?
Why has texas given substantial power to the justice system : How big of a role do you think socioeconomic factors such as education and income have on the type of people we see on death row? What other factors do you think are important?
Compute immediate deflection due to dead load and live load : Compute the immediate deflection due to dead load and live load. Compute the long-term deflection due to the dead load. Assume the time period for sustained loads to be in excess of 5 years.
Find the sample correlation coefficient between x and y : Find the sample correlation coefficient between X and Y. How would you decide if a simple linear regression model is appropriate for the relationship between X and Y
Write a paper on the given topic : Imagine that you are a and are conducting a to investigate a community problem. Using behavioral principles, select a macro systems to invstigate.
What are the roles of remaining open-minded : Voting can change the future of a generation or a nation. For that reason, voting is most effective when it is thoughtful rather than mechanical. What are the roles of remaining open-minded, being informed, and engaging in political dialogue in m..
What is an appropriate sample space for this experiment : QUALITY CONTROL As part of a quality-control procedure, an inspector at Bristol Farms randomly selects ten eggs from each consignment of eggs he receives and records the number of broken eggs.
Who does undervalued and overvalued currency tend to hurt : Who does undervalued and overvalued currency tend to hurt? Why would overvalued currency concerns receive more attention than undervalued currency concerns?

Reviews

Write a Review

Econometrics Questions & Answers

  Design a simple econometric research project

Design a simple econometric research project

  Multiplicative decomposition method

Multiplicative decomposition method

  Market for cigarettes

The Australian government administers two programs that affect the market for cigarettes.

  Solve the forecast model

Solve the forecast model

  What are the marginal abatement cost functions

What are the marginal abatement cost functions for each of the two areas? Calculate the loss in the two areas due to over-control (for the rural area) and under-control (for the urban area).

  Write the t statistic for testing the null hypothesis

Explain why this model violates the assumption of no perfect collinearity.  Write the t statistic for testing the null hypothesis

  What is economics system

What is economics system? What are the types of economics system? Briefly explain each type of economics system by giving examples of nations that are close to each type

  Multiple choice questions related to market concentration

Determine when a competitively produced product generates negative externalities in production, the industry will,

  Calculating number of units produced by firm

Assume a company has the following production function: Q = 100 K.5 L1 . Currently, the company hires 1,000 workers and employs 100 units of capital.

  Question about mobile commerce

M-commerce also known as mobile commerce is being lumped in with several strategic internet plans. Explain some of the industries that are likely to use mobile commerce and how it is working for them.

  Calculating the average days past due and average flow time

Auto Data manufactures custom engineering testing machine. The following 5-orders are currently in the design department:

  Mechanism of an english auction and second price auction

Briefly discuss the difference between mechanism of an oral or English auction and a Vickrey or second price auction.

Free Assignment Quote

Assured A++ Grade

Get guaranteed satisfaction & time on delivery in every assignment order you paid with us! We ensure premium quality solution document along with free turntin report!

All rights reserved! Copyrights ©2019-2020 ExpertsMind IT Educational Pvt Ltd