Reference no: EM131373473
Problem Set
Question 1:
An economy's technology is described by the following Cobb-Douglas production function.
Y = K0.50N0.50
Where, Y is the real GDP and K and N are the amounts of capital and labor. We have the following information about this economy:
Labor grows at an annual rate of 2% per year → n = 0.02
Annual depreciation rate of capital is 3% → d = 0.03
Saving rate is 25% → s = 0.25
a. Find the steady state levels of k and y. Show this case in a nice and readable Solow diagram (the graph must be fully labeled with the values of k*, y*, (d + n)×k* and s×y*.
b. If "this year" capital per worker was k = 9, at what rate would it change from "this year" to "the next year" (in other words, calculate Δk/k)? What if k was equal to 16? Show these cases in a Solow diagram. From this exercise, what do you conclude about the relationship between k and Δk/k? What is the economics behind this relationship?
Hint: Even though we did not prove it in the class, the difference between the actual investment per worker (s×y) and the one required to keep k constant ((d + n)×k)) equals the change in k. Specifically,
?k = sy - (d + n)k
c. Suppose that "this year" we are in steady state with K = 2,500 and Y = 500. Assuming steady state, if you look at this economy "next year", what will you find for the values of K, N, Y, k, and y?
Question 2:
An economy's technology is described by the following Cobb-Douglas production function.
Y = AK0.25N0.75
Where, Y is the real GDP and K and N are the amounts of capital and labor. Currently the technology parameter equals A = 16. We have the following additional information about this economy:
Labor grows at an annual rate of 1% per year → n = 0.01
Annual depreciation rate of capital is 4% → d = 0.04
Saving rate is 20% → s = 0.20
a. Find the steady state levels of k and y. For the sake of argument let's suppose that this solution pertains to the year 2016. Show this case in a nice and readable Solow diagram (the graph must be fully labeled with the values of k*2016, y*2016, (d + n)k*2016, and s × y2016.
b. Technology improves by 5% from 2016 to 2017. Find the values of k2017, y2017. Show all the shifts with the 2016 and 2017 equilibrium values in a Solow diagram.
c. Find the rates of growth of the steady-state capital per worker and GDP per worker. Show your work.
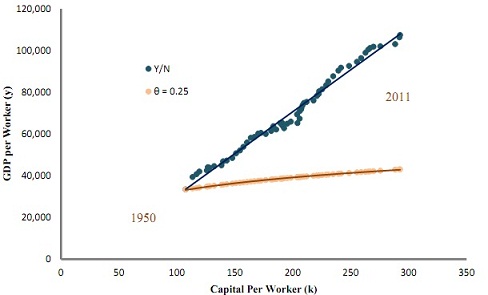
d. Now here is the cool part. Consider the graph below that you have seen several times before. It shows that, unlike what Cobb-Douglas predicts, the relationship between k and y for the U.S. was more or less linear (no diminishing returns to capital). One way to resolve this conflict was to argue that improvements in technology (know-how) had caused the function to shift up over years so that the actual (blue) points observed in the graph are the steady-state k-y pairs lying on different production functions. Assume that technology improves one more time in 2018 by the same 5%. Find the values of k*2018 and y*2018. Do the three k*-y* pairs for 2016,
2017, and 2018 lie on a straight line? If yes, what is the equation of this line?
|
Is this a one tailed or a two tailed test
: Is this a one-tailed or a two-tailed test? Explain.- Carry out the hypothesis test at the 0.05 level of significance.- State your conclusion.- What is the p-value? Explain its relevance.
|
|
Calculate the number of moles of bicarbonate and acetic acid
: Calculate the number of moles of bicarbonate and acetic acid in each test tube in the inquiry activity using the following information.assume the density of the vinegar is 1.0g/ml and that the solution is 5% acetic acid.
|
|
Test for a difference between means
: New corporate strategies take years to develop. Two methods for facilitating the development of new strategies by executive strategy meetings are to be compared.- Test for a difference between means, using α = 0.05.
|
|
Briefly describe your experience of unforgettable arguments
: Introductory Essay - Arguments in My Life - Worksheet. Briefly describe your experience of 2-3 unforgettable arguments, and them choose one that will allow you to tell an interesting story. Who, describe you, were the participants
|
|
Find the rates of growth of steady-state capital per worker
: ECN 101- An economy's technology is described by the following Cobb-Douglas production function. Find the rates of growth of the steady-state capital per worker and GDP per worker. Show your work.
|
|
Explain how you reached your conclusion
: Using the α = 0.01 level of significance, test the null hypothesis that both methods of advertising are equally effective versus the alternative hypothesis that they are not equally effective. If you conclude that one method is better, state which..
|
|
Prepare a three year financial model
: Please prepare a three year financial model that you will present to the management team. The analysis needs to demonstrate what level of incremental revenue is needed over a 3 year time horizon to meet our 10% hurdle rate.
|
|
What job do you plan to have in the health care sector
: HCS 449: In addition to the personal goals you set in Week Three, this week you will be setting professional career goals. These are goals that relate to your chosen career, what type of job you want, and what steps you need to take to secure that..
|
|
Is the average sale price of all properties in both location
: A random sample of 35 properties in Marin County gives x‾= $4.32 million and s = $0.87 million. Is the average sale price of all properties in both locations approximately equal or not? Explain
|