Find the range of each set of numbers

Assignment Help Algebra
Reference no: EM131020937

1. Find the median of each set of numbers.

1, 4, 9, 15, 25, 36

2. Find the mode of each set of numbers.

a. 41, 43, 56, 67, 69, 72

b. 9, 8, 10, 9, 9, 10, 8

3.  Statistics. A salesperson drove 238, 159, 87, 163, and 198 miles (mi) on a 5-day trip. What was the mean number of miles driven per day?

4. Business and finance. The following scores were recorded on a 200-point final examination: 193, 185, 163, 186, 192, 135, 158, 174, 188, 172, 168, 183, 195, 165, 183.

(a) Find the mean final examination score.

(b) Find the median final examination score.

(c) Is the mean or median a more useful representative of the final examination scores? Write a brief paragraph justifying your response.

5.

Continent or Region          Land Area          % of earth        Population          Population            Population
                                      (1,000 mi2)                                  1900                 1950                    2000
North America                      9,400                  16.2          106,000,000      221,000,000         305,000,000
South America                     6,900                  11.9          38,000,000        111,000,000         515,000,000
Europe                                3,800                  6.6           400,000,000       392,000,000         510,000,000
Asia (including Russia)          17,400                30.1          932,000,000       1,591,000,000     4,028,000,000
Africa                                  11,700                20.2          118,000,000       229,000,000         889,000,000
Oceana (including Australia)   3,300                  5.7           6,000,000           12,000,000          32,000,000
Antarctica                            5,400                  9.3           Uninhabited                -                         -
World total                          57,900                                1,600,000,000     2,556,000,000      6,279,000,000

Use the world population and land area table in the tex. Round answers to the nearest tenth or tenth of a percent.

i. (a) What is the population of Europe in 2000?

(b) What is the total area of Europe?

ii. Compare the population per square mile in Asia to the population per square mile in North America for the year 2000.

iii. What is the percent increase in the population for all six inhabited continents, excluding Asia, from 1950 to 2000?

iv. What was the percent increase in the population in South America from 1900 to 2000?

v. (a) What was the mean population of the six continents or land masses that were habitable in 2000?

(b) What was the mean population in 1950?

(c) What was the percent increase in the mean population from 1950 to 2000?

6. Use the graph below, showing the number of robberies in a town during the last 6 months of a year.

463_Graph for number of robberies in a town.png

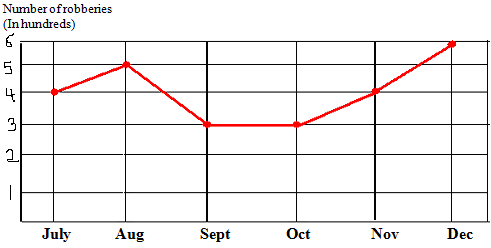
i. How many robberies occurred in November?

ii. What was the mean number of robberies per month over the last 6 months?

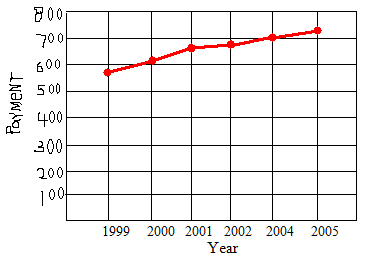
iii. The graph and table below give the monthly principal and interest payments for a mortgage from 1999 to 2004. Use this information to predict the payment for 2005.

Year        Payment

1999           $578

2000             613

2001             654

2002             675

2003             706

2004             730

2005

2171_The monthly principal and interest payments.png

7. The table below gives the median earnings of women aged 25 and older who work full-time, year round, by educational attainment, according to the 2000 census.

Education                                Earnings

HS diploma or GED                    $23,719

Associate's degree                     30,178

Bachelor's degree                      38,208

Master's degree                         47,049

Doctorate's degree                    55,620

Create a bar graph from this information.

The following pie chart shows the budget for a local company. The total budget is $600,000. Find the amount budgeted in each of the following categories.

1015_Pie chart for the budget for a local company.png

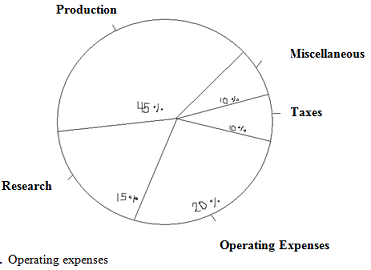
8. Operating expenses

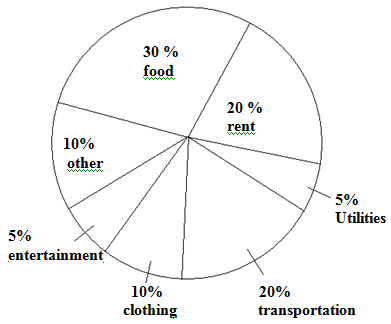
The following pie chart shows the distribution of a person's total yearly income of $24,000. Find the amount budgeted for each category.

2115_Pie chart for persons total yearly income.png

9. The following table gives the number of Senate members with military service in the 106th U.S. Congress, by branch.

Branch         Count

Army                17

Navy                 10

Air Force           4

Marines              6

Coast Guard       1

National Guard   2

Construct a pie chart from this information.

11. Find the median of each set of numbers.

26, 30, 38, 67, 59, 21, 17, 85, 22, 22

12. Give the five-number summary of each set of numbers.

7, 7, 5, 4, 1, 9, 8, 8, 8, 5, 2

13. One measure used to describe a data set is the range. The range of a data set is given by the difference between the max and the min of the set. The range describes the variability of the data (that is, how much do the numbers vary).

Range = max - min

Find the range of each set of numbers.

7, 7, 5, 4, 1, 9, 8, 8, 8, 5, 2

Reference no: EM131020937

Questions Cloud

What are sales net of cash discounts taken : Foster Industries sells on terms of 2/10, net 35. Gross sales last year were $450,000, and ac- counts receivable averaged $60,000. Half of Foster’s customers paid on Day 10 and took discounts. What are Foster’s sales net of cash discounts taken?
Government bonds trading in the market : You are a bond trader and observe the following three US government bonds trading in the market: (Face value = $1000.) What is the market interest rate that applies to all bonds? What is the YTM on the three bonds? Suppose now you see the following U..
Bond making annual coupon payments : Consider a 10 year bond making annual coupon payments at a rate of 8% with a face value of $1000. The market interest rate is 8%. Suppose you decide to buy the bond today and hold it for 10 years. What is the price of the bond and your (holding perio..
Axcel software began a new development project : Axcel Software began a new development project in 2015. The project reached technological feasibility on June 30, 2016, and was available for release to customers at the beginning of 2017.
Find the range of each set of numbers : One measure used to describe a data set is the range. The range of a data set is given by the difference between the max and the min of the set. Find the range of each set of numbers. 7, 7, 5, 4, 1, 9, 8, 8, 8, 5, 2.
Stock is expected to provide a dividend : Consider the following two stocks: Stock A is expected to provide a dividend of $16 a share forever. Stock B is expected to pay a dividend of $8 next year. Thereafter, dividend growth is expected to be 15% a year for seven years (i.e., until year 8) ..
What other ways would you approach the appraisal of a home : What percentage of the value assessment do you feel a kitchen or bathroom condition should contribute towards the final value estimate?
Find the imputed interest income in dollars in the first : A newly issued 20-year maturity, zero-coupon bond is issued with a yield to maturity of 8.3% and face value $1,000. Find the imputed interest income in dollars in the first, second, and last year of the bond's life.
What is the appropriate inflow and outflow relationship : Find an existing budget from a published source. Detail should be extensive enough to present a challenge. Use this checklist for building a budget and critque your work. what is the proposed volume for the new budget period? what is the appropriate ..

Reviews

Write a Review

Algebra Questions & Answers

  Solve the given expression

Solve the given expression

  Difference between equation and expression

What is the difference between an equation and an expression? How does knowing how to simplify an expression help with solving an equation?

  The population of the city was 94 thousand in 1992 the

the population of a city was 94 thousand in 1992. the exponential growth rate was 1.6 per year. find the exponential

  Question regarding degree of polynomial

Identify the degree of each term of the polynomial and the degree of the polynomial.

  Quadratic equation select a quadratic equation and solve it

select a quadratic equation and solve it using the quotcompleting the squarequot method. show your work in full

  Greatest common factor for expression

What process do you use for coming up with the GCF? The greatest common factor is 3xy

  Estimate of which candidate would win on election day

What sampling techniques would you use to get the most accurate estimate of which candidate would win on election day?

  Assume that the percentage annual return you obtain when

suppose that the percentage annual return you obtain when you invest a dollar in gold or the stock market is dependent

  Rational exponent and complex numbers hello please complete

hello please complete the questions and submit back to me. if i have additional questions regarding the same questions

  Equation for relationship between number of hours

Write an equation for the relationship between the number of hours Trevor worked on Sunday h and number of flyers that he distributed on Sunday s.

  The library floor similar to the floor of the 9 foot by 12

the library floor similar to the floor of the 9 foot by 12 foot bedroom. the scale factor from the bedroom to the

  Determine the concavity of each part of the graph

Find all the points of inflection of f(x). Determine the concavity of each part of the graph, showing your results in a table. Sketch the graph on a suitable scale showing the concavity and points of inflection.

Free Assignment Quote

Assured A++ Grade

Get guaranteed satisfaction & time on delivery in every assignment order you paid with us! We ensure premium quality solution document along with free turntin report!

All rights reserved! Copyrights ©2019-2020 ExpertsMind IT Educational Pvt Ltd