Find the lower quartile of the ages

Assignment Help Basic Statistics
Reference no: EM131657291

Introductory Statistics Assignment -

Questions 1 to 15 are multiple-choice questions.

Q1. You asked 5 of your classmates about their height. On the basis of this information, you stated that the average height of all students in your university is 5 feet and 6 inches. This is an example of:

A) descriptive statistics 

B) inferential statistics

C) parameter    

D) population

2. In statistics, a population consists of:

A) all people living in a country

B) all people living in the area under study

C) all subjects or objects whose characteristics are being studied

D) none of the above

Q3. In statistics, a sample means:

A) people living in one city only

B) a portion of the population

C) all items under investigation 

D) none of the above

Q4. In statistics, conducting a census means:

A) making decisions based on sample results

B) checking if a variable is qualitative or quantitative

C) collecting information from all members of the population

D) none of the above

5. In statistics, a representative sample is the sample that:

A) contains the characteristics of the populations as closely as possible

B) represents the results of a sample exactly

C) contains all people living in a area

D) none of the above

Q6. Which of the following is not an example of primar.), data?

A) Data published by the Central Statistical Office of Trinidad and Tobago

B) Data published by the Trinidad and Tobago Stock Exchange

C) Data published by the Central Bank of Trinidad and Tobago

D) None of the above

Q7. When every possible sample of size n has the same chance of being selected, this is called:

A) simple random sampling        

B) stratified random sampling

C) cluster sampling         

F) quota sampling

Q8. When a sample is divided into mutually exclusive sets, and then a simple random sample is drawn from each set, this is called:

A) simple random sampling        

B) stratified random sampling

C) cluster sampling         

D) convenience sampling

Q9. The best type of chart for comparing two sets of categorical data is:

A) a line chart   

B) a pie chart

C) a histogram  

D) a bar chart

Q10. The most appropriate type of chart for determining the number of observations at or below a specific value is:

A) a histogram  

B) a pie chart

C) a. box-and-whisker diagram 

D) a ogive

Q11. Since the population is always larger than the sample, the population mean:

A) is always larger than the sample mean

B) is always smaller than the sample mean

C) is always larger then or equal to the sample mean

D) can be smaller than, or larger than, or equal to the sample mean

Q12. Which of the following measures cannot be easily approximated from a box-and-whisker diagram?

A) the range      

B) the interquartile range

C) the standard deviation            

D) none of the above

Q13. The average score for a class of 30 students was 75. The 20 males students in the class averaged 70. The female students in the class averaged:

A) 75     

B) 85     

C) 65     

D) 80

14. Expressed in percentiles, the interquartile range is the difference between the:

A) 10% and 60% values 

B) 45% and 95% values

C) 25% and the 75% values         

D) 15% and the 65% values

Q15) Which one of the following statements is true?

A) when the distribution is skewed to the left, mean median: mode

B) when the distribution is skewed to the right mean < median < mode

C) when the distribution is symmetric and  modal, mean = median = mode

D) when the distribution is symmetric and bimodal mean = median = mode

Questions 16 to 18 are based on the following data, which are the ages in years of the sample of 25 employees from a government department:

31           43           56           23           49

42           33           61           44           28

48           38           44           35           40

64           52           42           47           39

53           27           36           35           20

16) Construct a stem-and-leaf diagram for the ages.

17) From the stem-and-leaf diagram constructed in Question 16:

(a) Find the median age

(b) Find the lower quartile of the ages

(c) Find the 60% percentile of the ages

(d) Compute the range of the data

Q18) (a) Construct a frequency distribution for the data, using five class intervals and the value 20 as the lower limit of the first class.

(b) Calculate the mean and the variance of the ages from the frequency distribution constructed in part (a).

Q19) The marks of a sample of students doing ECON1005 were processed using MINITAB. The outputs obtained are shown below:

1253_figure.png

947_figure1.png

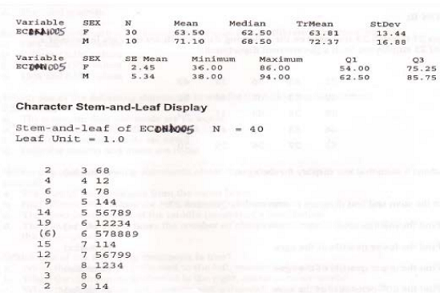
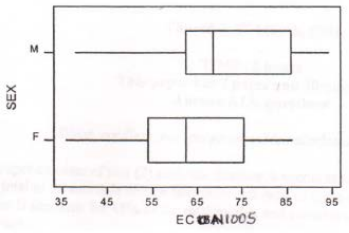
(a) What is the modal score of the ECON1005 marks?

(b) Comment on the relative performance of the male and female students who did ECON1005.

(c) Calculate the quartile deviation for the marks in ECON1005.

Reference no: EM131657291

Questions Cloud

Discuss the difference between attributes and variables data : Discuss the differences between attributes and variables data. What are the four levels of follower maturity defined by the situational leadership theory?
What types of risks might be introduced to a project : What types of risks might be introduced to a project when teams are culturally or geographical diverse? How could these risks be mitigated?
Analyze the belief system that serves as the foundation : Describe and analyze the belief system that serves as the foundation for your organization’s culture.
Was d-amato liable for trademark infringement : Even so, Audi sued him for trademark infringement and dilution when it learned of his activities. Was D'Amato liable for trademark infringement?
Find the lower quartile of the ages : ECON1005 Introductory Statistics Assignment - From the stem-and-leaf diagram constructed in Question 16: Find the lower quartile of the ages
Was ran entitled to win on appeal : When both parties moved for summary judgment, the trial court held for Hudesman. RAN appealed. Was RAN entitled to win on appeal?
Kitchen chairs wants to compare productivity : A company that makes kitchen chairs wants to compare productivity at two of its facilities. At facility #1, eight (8) workers produced 320 chairs.
Compare and contrast given plan with existing legislation : Compare and contrast this plan with existing legislation. In a thoroughly research response, respond to the validity of its implementation in society today.
What issues has they had with quality management globally : What are six components of Starbuck's Coffee supply chain? What issues has they had with quality management globally?

Reviews

len1657291

9/25/2017 6:01:48 AM

ONLY questions 16-19 are to be answered. Not the multiple choice questions. Thank you. This assignment is to be prepared as a WORD document. This is NOT a group assignment. It is expect that you will do your own work. Presentation of another person's work will be severely penalized. Upload your submission to the appropriate drop box for grading by your e-tutor. Handwritten submissions can be scanned and uploaded to the dropbox for grading however, care must be taken to ensure that the submission must be legible, not distorted in any way and is not rotated. The dropbox is set to accommodate only one file. Please be guided accordingly.

Write a Review

Basic Statistics Questions & Answers

  What would be the probability of a simple random sample

If this university's overall pass rate for the Maryland bar exam were really 75%, what would be the probability of a simple random sample of 400 having a pass rate of 60% or less? Based on this probability, comment on the dean's explanation.

  Test scores on a university admissions test are normally

test scores on a university admissions test are normally distributed with a mean of 500 and a standard deviation of

  Determine the probability distribution for y

Consider a system of water flowing through valves from A to B. (See the accompanying diagram.) Valves 1, 2, and 3 operate independently, and each correctly opens on signal with probability .8. Find the probability distribution for Y , the number o..

  Explain why might normality be an issue

Construct a 95 percent confidence interval for the true mean. (b) Why might normality be an issue here? (c) What sample size would be needed to obtain an error of ±10 square millimeters.

  Correlations of all the explanatory variables

What are the correlations of all the explanatory variables with GPA? Explain why knowing the correlations tell us which variables will best predict GPA in a regression with just one explanatory variable. What are the two best predictor variables? ..

  Difference in exam scores

The mean score in the male group was 84±4.0 (M±SD); in the female group, it was 78±8.0 (M±SD) points. If the null hypothesis is that there is no difference in exam scores, then test the null hypothesis at a 0.05 level of significance.

  Find sample is likely to be representative of population

Identify the sample and population. Also, determine whether the sample is likely to be representative of the population.

  In a remote tropical region there is a direct road from a

in a remote tropical region there is a direct road from a to b but it is impassable about 50 of the time due to rain.

  Calculate the mean of moviegoers

This problem relates to Basic Statistics and it is about calculate the mean of moviegoers and concluding whether or not the sample can represent the entire population. This has been described in the solution with calculation

  What is the probability that a student

Scores on exam-2 are normally distributed with a mean of 66 and standard deviation 1.5 a) What is the probability that a student selected at random has a score below 60 on this exam?

  A multiple regression model

When a multiple regression model is used for estimating the mean of the dependent variable and for predicting a new value of y, which will be narrower-the confidence interval for the mean or the prediction interval for the new y value? Why?

  Perform an analysis of variance for the data

Perform an analysis of variance for the data. Display the computed quantities in an ANOVA table.- Find the value of R2 that would be obtained if you were to fit the linear model in part b to the data.

Free Assignment Quote

Assured A++ Grade

Get guaranteed satisfaction & time on delivery in every assignment order you paid with us! We ensure premium quality solution document along with free turntin report!

All rights reserved! Copyrights ©2019-2020 ExpertsMind IT Educational Pvt Ltd